React 实现 Echarts 可视化饼状图
**
一、 引入
**
import React, { Component } from 'react'

import 'echarts/lib/echarts';
//导入饼图
import 'echarts/lib/chart/pie'
import 'echarts/lib/component/tooltip'
import 'echarts/lib/component/title'
import 'echarts/lib/component/legend'
import 'echarts/lib/component/markPoint'
import ReactEcharts from 'echarts-for-react'
//引入css样式
import styles from './Echarts.module.scss'
二、编写可视化
export default class EchartAge extends Component {
getEchartAge = ()=>{
let option = {
backgroundColor: 'rgba(2, 36, 150, 0.1)',
//图表标题
title: {
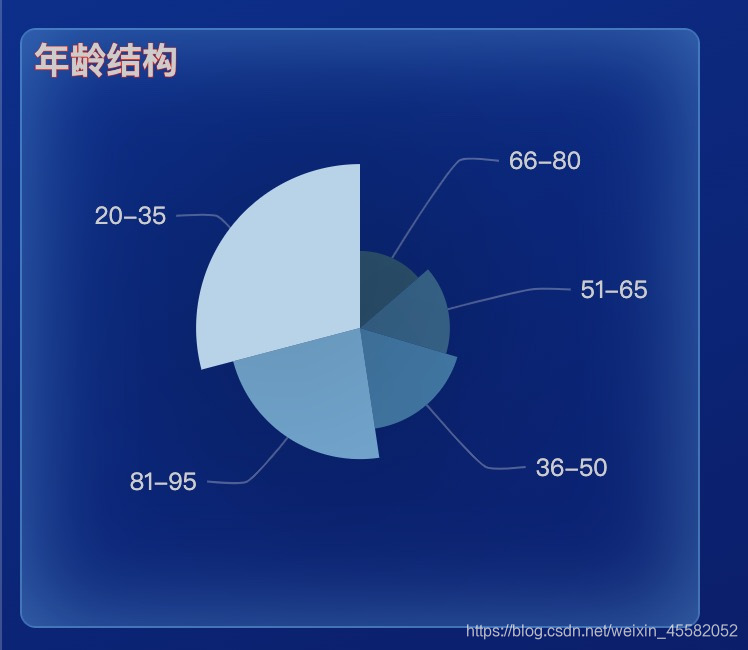
text: '年龄结构',
left: 1,
top: 1,
width: '12rem',
height: '24rem',
textStyle: {
color: '#ccc',
textBorderColor: 'red'
}
},
tooltip: {
trigger: 'item',
formatter: '{a} <br/>{b} : {c} ({d}%)'
},
visualMap: {
show: false,
min: 80,
max: 600,
inRange: {
colorLightness: [0, 1]
}
},
series: [
{
name: '年龄',
//图表类型
type: 'pie',
radius: '55%',
//图表位置
center: ['50%', '50%'],
data: [
{value: 500, name: '20-35'},
{value: 310, name: '36-50'},
{value: 274, name: '51-65'},
{value: 235, name: '66-80'},
{value: 400, name: '81-95'}
].sort(function (a, b) { return a.value - b.value; }),
roseType: 'radius',
label: {
color: '#ccc',
},
labelLine: {
lineStyle: {
color: 'rgba(255, 255, 255, 0.3)'
},
smooth: 0.2,
length: 10,
length2: 20
},
itemStyle: {
color: '#358bc2',
shadowBlur: 200,
shadowColor: 'rgba(0, 0, 0, 0.5)'
},
animationType: 'scale',
animationEasing: 'elasticOut',
animationDelay: function (idx) {
return Math.random() * 200;
}
}
]
};
return option;
}
render() {
return (
<div className={styles.echart_age_page}>
<ReactEcharts className={styles.echart_public_pie_form} option={this.getEchartAge()}/>
</div>
)
}
}