版本
elasticsearch-6.0.0.tar.gz
logstash-6.0.0.tar.gz
kibana-6.0.0-linux-x86_64.tar.gz
总体流程
Nginx —生成—> access.log —> logstash进行收集 —> 收集到elasticsearch中进行存储 —> kibana进行展示
es部署
创建data目录和logs目录:
[hadoop@hadoop001 ~]$ cd /opt/app/elasticsearch-6.0.0/
[hadoop@hadoop001 elasticsearch-6.0.0]$ mkdir data
[hadoop@hadoop001 elasticsearch-6.0.0]$ mkdir logs
修改elasticsearch.yml:
[/opt/app/elasticsearch-6.0.0/config/elasticsearch.yml]
cluster.name: ruozedata_cluster
node.name: node131                                  ## 131为机器ip的尾号(192.168.26.131)
path.data: /opt/app/elasticsearch-6.0.0/data
path.logs: /opt/app/elasticsearch-6.0.0/logs
network.host: 192.168.26.131
启动es:
[hadoop@hadoop001 elasticsearch-6.0.0]$ bin/elasticsearch启动失败(通过查看进程发现):
[hadoop@hadoop001 elasticsearch-6.0.0]$ ps -ef | grep elastic
hadoop     3680   3438  0 06:36 pts/0    00:00:00 grep elastic
查看logs/ruozedata_cluster.log:
[2018-04-30T06:35:54,704][ERROR][o.e.b.Bootstrap          ] [node131] node validation exception
[4] bootstrap checks failed
[1]: max file descriptors [4096] for elasticsearch process is too low, increase to at least [65536]
[2]: max number of threads [1024] for user [hadoop] is too low, increase to at least [4096]
[3]: max virtual memory areas vm.max_map_count [65530] is too low, increase to at least [262144]
[4]: system call filters failed to install; check the logs and fix your configuration or disable system call filters at your own risk
针对4个报错的解决方案
问题1:
nofile 表示进程允许打开的最大文件数。elasticsearch 进程要求可以打开的最大文件数不低于 65536
[root@hadoop001 ~]# echo "* soft nofile 65536" >> /etc/security/limits.conf
[root@hadoop001 ~]# echo "* hard nofile 131072" >> /etc/security/limits.conf
问题2:
nproc 表示最大线程数。elasticsearch 要求最大线程数不低于 4096
hadoop为用户名
[root@hadoop001 ~]# echo "hadoop soft nproc 4096" >> /etc/security/limits.conf
[root@hadoop001 ~]# echo "hadoop hard nproc 4096" >> /etc/security/limits.conf
问题3:
vm.max_map_count 表示虚拟内存大小,它是一个内核参数。elasticsearch 默认要求 vm.max_map_count 不低于 262144。
临时生效
[root@hadoop001 ~]# sysctl -w vm.max_map_count=262144
vm.max_map_count = 262144
永久生效
[root@hadoop001 ~]# echo "vm.max_map_count=262144" >> /etc/sysctl.conf
[root@hadoop001 ~]# sysctl -p
net.ipv4.ip_forward = 0
net.ipv4.conf.default.rp_filter = 1
net.ipv4.conf.default.accept_source_route = 0
kernel.sysrq = 0
kernel.core_uses_pid = 1
net.ipv4.tcp_syncookies = 1
net.bridge.bridge-nf-call-ip6tables = 0
net.bridge.bridge-nf-call-iptables = 0
net.bridge.bridge-nf-call-arptables = 0
kernel.msgmnb = 65536
kernel.msgmax = 65536
kernel.shmmax = 68719476736
kernel.shmall = 4294967296
vm.max_map_count = 262144
问题4:
2种方案:
- 升级centos6 –> 7
- 选择禁用
进行禁用,修改配置文件elasticsearch.yml
[/opt/app/elasticsearch-6.0.0/config/elasticsearch.yml]
bootstrap.memory_lock: false
bootstrap.system_call_filter: false
查看是否修改成功
[root@hadoop001 ~]# ulimit -a
core file size          (blocks, -c) 0
data seg size           (kbytes, -d) unlimited
scheduling priority             (-e) 0
file size               (blocks, -f) unlimited
pending signals                 (-i) 31407
max locked memory       (kbytes, -l) 64
max memory size         (kbytes, -m) unlimited
open files                      (-n) 1024
pipe size            (512 bytes, -p) 8
POSIX message queues     (bytes, -q) 819200
real-time priority              (-r) 0
stack size              (kbytes, -s) 10240
cpu time               (seconds, -t) unlimited
max user processes              (-u) 31407
virtual memory          (kbytes, -v) unlimited
file locks                      (-x) unlimited
发现并没有全部生效,需要进行重启之后,才会进行生效
重新启动es:
-d 表示不直接打印日志在控制台上
[hadoop@hadoop001 elasticsearch-6.0.0]$ bin/elasticsearch -d查看进程,看es是否起来了
[hadoop@hadoop001 elasticsearch-6.0.0]$ ps -ef | grep elastic看日志,看es是否起来了
[2018-04-30T14:04:34,820][INFO ][o.e.n.Node               ] [node131] started
[2018-04-30T14:04:34,829][INFO ][o.e.g.GatewayService     ] [node131] recovered [0] indices into cluster_state
标志es启动成功:
[hadoop@hadoop001 logs]$ curl -XGET '192.168.26.131:9200/?pretty'
{
  "name" : "node131",
  "cluster_name" : "ruozedata_cluster",
  "cluster_uuid" : "BjfFLxYUR9S9WYdDRC60sQ",
  "version" : {
    "number" : "6.0.0",
    "build_hash" : "8f0685b",
    "build_date" : "2017-11-10T18:41:22.859Z",
    "build_snapshot" : false,
    "lucene_version" : "7.0.1",
    "minimum_wire_compatibility_version" : "5.6.0",
    "minimum_index_compatibility_version" : "5.0.0"
  },
  "tagline" : "You Know, for Search"
}

[hadoop@hadoop001 logs]$ jps
3233 Jps
3182 Elasticsearch
Nginx部署
安装PCRE库
[hadoop@hadoop001 ~]$ su - root
[root@hadoop001 ~]$ cd /opt/software/
[root@hadoop001 software]$ tar -zxvf pcre-8.36.tar.gz -C /opt/app/
[root@hadoop001 app]$ cd pcre-8.36/
[root@hadoop001 pcre-8.36]$ ./configure
[root@hadoop001 pcre-8.36]$ make
[root@hadoop001 pcre-8.36]$ make install
安装zlib库
[root@hadoop001 pcre-8.36]# cd /opt/software/
[root@hadoop001 software]# tar -zxvf zlib-1.2.8.tar.gz -C /opt/app/
[root@hadoop001 software]# cd /opt/app/zlib-1.2.8/
[root@hadoop001 zlib-1.2.8]# ./configure
[root@hadoop001 zlib-1.2.8]# make
[root@hadoop001 zlib-1.2.8]# make install
安装ssl
[root@hadoop001 zlib-1.2.8]# cd /opt/software/
[root@hadoop001 software]# tar -zxvf openssl-1.0.1j.tar.gz -C /opt/app/
[root@hadoop001 software]# cd /opt/app/openssl-1.0.1j/
[root@hadoop001 openssl-1.0.1j]# ./config
[root@hadoop001 openssl-1.0.1j]# make
[root@hadoop001 openssl-1.0.1j]# make install
安装Nginx
[root@hadoop001 local]# cd /usr/local
[root@hadoop001 local]# wget http://nginx.org/download/nginx-1.8.0.tar.gz
[root@hadoop001 local]# cd nginx-1.8.0/
[root@hadoop001 nginx-1.8.0]# ./configure --prefix=/usr/local/nginx --with-pcre=/opt/app/pcre-8.36 --with-zlib=/opt/app/zlib-1.2.8
[root@hadoop001 nginx-1.8.0]# make
[root@hadoop001 nginx-1.8.0]# make install
启动Nginx
[root@hadoop001 nginx]# /usr/local/nginx/sbin/nginx查看状态和配置文件
-t 查看当前配置文件是否OK,当前状态是否OK
[root@hadoop001 nginx]# /usr/local/nginx/sbin/nginx -t
nginx: the configuration file /usr/local/nginx/conf/nginx.conf syntax is ok
nginx: configuration file /usr/local/nginx/conf/nginx.conf test is successful
查看进程
[root@hadoop001 nginx]# ps -ef | grep nginx查看端口号
[root@hadoop001 nginx]# netstat -nlp | grep nginx默认端口是80
解决端口冲突的2种方法:
- httpd的服务,默认端口是80,因此需要将其停止
- 修改nginx.conf
[root@hadoop001 ~]# cd /usr/local/nginx/conf/
[root@hadoop001 conf]# vi nginx.conf
修改下列内容:
log_format  main  '$remote_addr - $remote_user [$time_local] "$request" '
                  '$status $body_bytes_sent "$http_referer" '
                  '"$http_user_agent" "$http_x_forwarded_for"';

access_log  logs/access.log  main;

listen       888;
server_name  hadoop001;
通过 http://192.168.26.131:888/ 去访问Nginx的web ui
[root@hadoop001 logs]# cd /usr/local/nginx/logs
[root@hadoop001 logs]# tail -F access.log
logstash部署
[root@hadoop001 logs]# cd /opt/app/logstash-6.0.0/
[root@hadoop001 logstash-6.0.0]# vi logstash-nginx-access-log.conf
input {
    file {
        path => ["/usr/local/nginx/logs/access.log"]
        type => "nginx_access"
        start_position => "beginning"
    }
}

filter {
  grok {
    match => {
      "message" => '%{IPORHOST:remote_ip} - %{DATA:user_name} \[%{HTTPDATE:time}\] "%{WORD:request_action} %{DATA:request} HTTP/%{NUMBER:http_version}" %{NUMBER:response} %{NUMBER:bytes} "%{DATA:referrer}" "%{DATA:agent}"'
    }
  }

  date {
    match => [ "time", "dd/MMM/YYYY:HH:mm:ss Z" ]
    locale => en
  }}

output {
  elasticsearch {
        hosts => ["192.168.26.131:9200"]
        index => "logstash-nginx-access-log"
    }
  # 输出到当前的控制台
  stdout { codec => rubydebug }
}
启动logstash
[hadoop@hadoop001 ~]$ cd /opt/app/logstash-6.0.0
[hadoop@hadoop001 logstash-6.0.0]$ nohup bin/logstash -f logstash-nginx-access-log.conf  &
[hadoop@hadoop001 logstash-6.0.0]$ tail -F nohup.out
刷新一次http://192.168.26.131:888/,就会有日志收集过来,并在控制台上打印出来(从Nginx的日志中收集过来,因此Nginx也需要启动)
{
           "request" => "/",
    "request_action" => "GET",
             "agent" => "Mozilla/5.0 (Windows NT 6.3; WOW64) AppleWebKit/537.36 (KHTML, like Gecko) Chrome/63.0.3239.132 Safari/537.36",
         "user_name" => "-",
      "http_version" => "1.1",
           "message" => "192.168.26.1 - - [01/May/2018:10:12:26 +0800] \"GET / HTTP/1.1\" 304 0 \"-\" \"Mozilla/5.0 (Windows NT 6.3; WOW64) AppleWebKit/537.36 (KHTML, like Gecko) Chrome/63.0.3239.132 Safari/537.36\" \"-\"",
              "type" => "nginx_access",
              "path" => "/usr/local/nginx/logs/access.log",
          "referrer" => "-",
        "@timestamp" => 2018-05-01T02:12:26.000Z,
         "remote_ip" => "192.168.26.1",
          "response" => "304",
             "bytes" => "0",
          "@version" => "1",
              "host" => "hadoop001",
              "time" => "01/May/2018:10:12:26 +0800"
}
kibana部署
[hadoop@hadoop001 ~]$ cd /opt/software/
[hadoop@hadoop001 software]$ tar -zxvf kibana-6.0.0-linux-x86_64.tar.gz -C /opt/app/
[hadoop@hadoop001 software]$ cd /opt/app/kibana-6.0.0-linux-x86_64/
[hadoop@hadoop001 kibana-6.0.0-linux-x86_64]$ cd config/
修改如下配置信息:
server.host: "192.168.26.131"
elasticsearch.url: "http://192.168.26.131:9200"
启动kibana
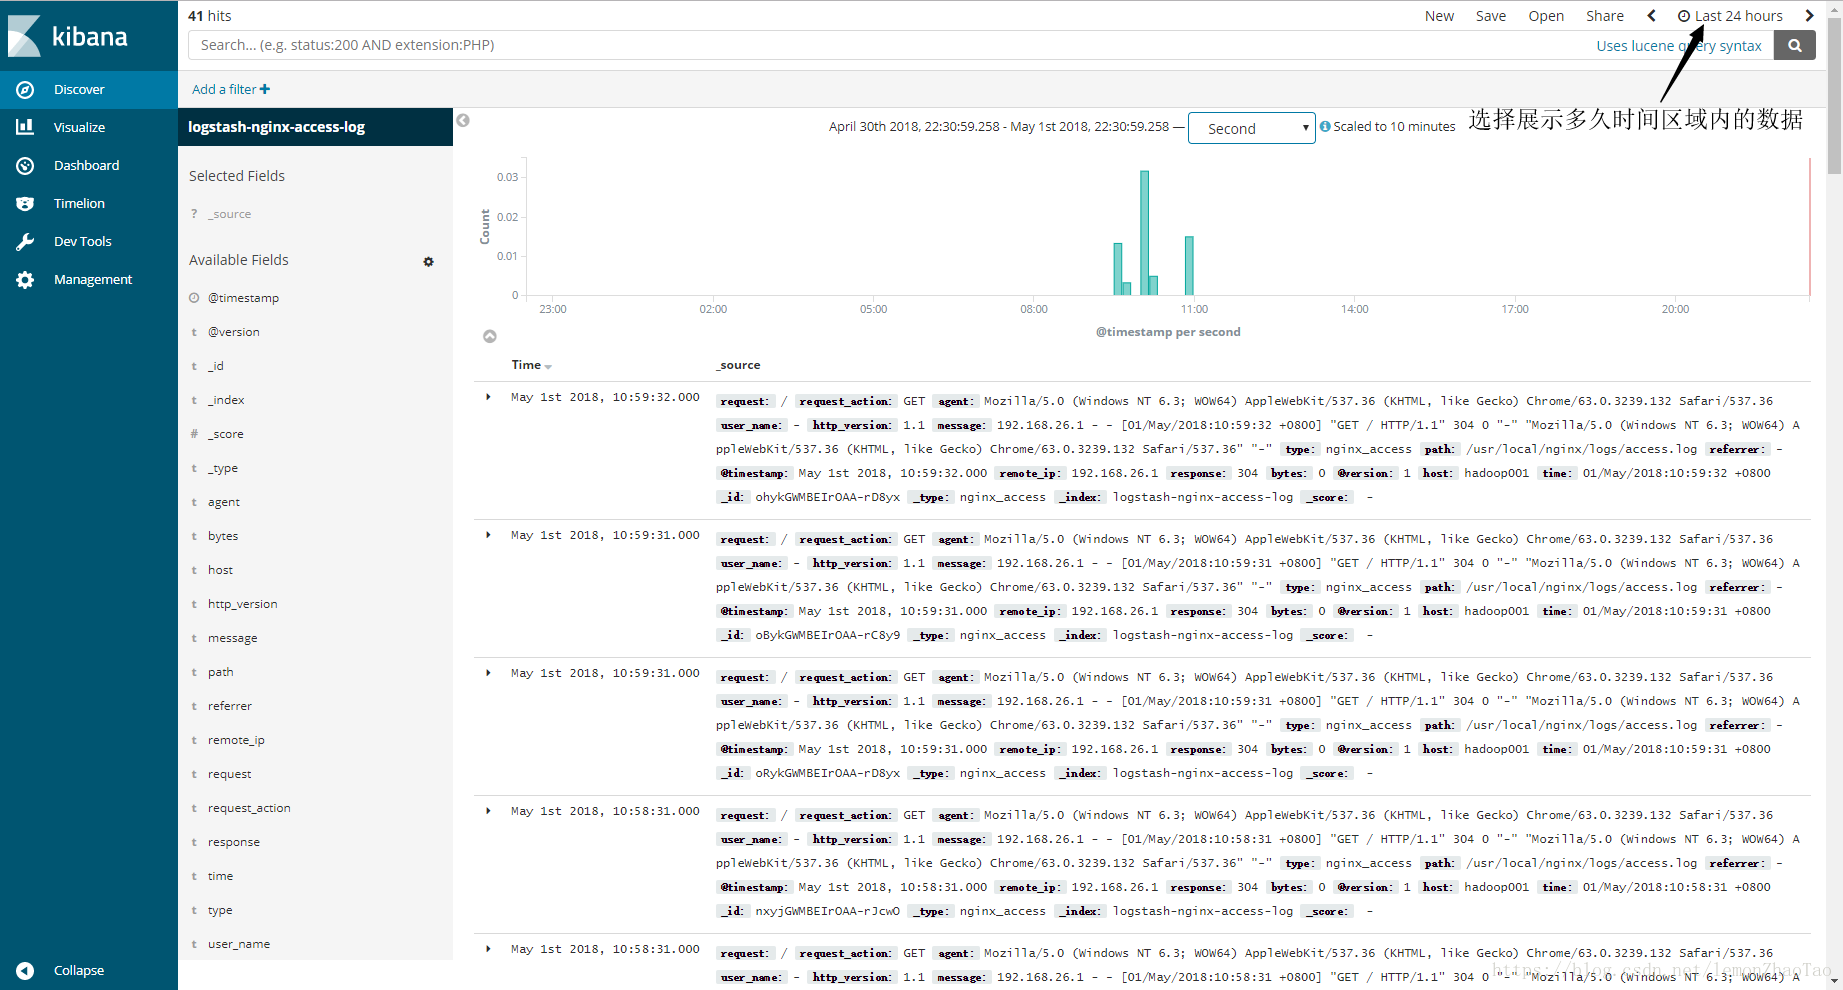
[hadoop@hadoop001 kibana-6.0.0-linux-x86_64]$ bin/kibana通过 http://192.168.26.131:5601 可以进行访问
在Management中配置
Index pattern               logstash-nginx-access-log  (即logstash-nginx-access-log.conf中配置的index的值)
Time Filter field name      @timestamp
配置完之后,有图片展示: