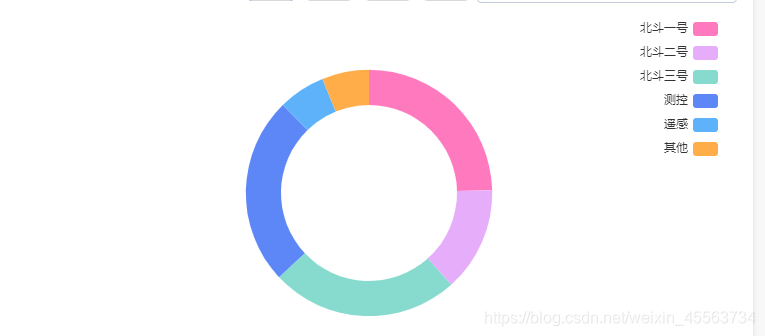
echarts饼状图初始化
<script src="/static/indicator/echarts.common.min.js"></script>
<div id="myTaskPie" class="myTask-right-pie"></div>


//初始化我的任务环图
function initMyTaskPie() {
    myChart = echarts.init(document.getElementById('myTaskPie'));

    // 指定图表的配置项和数据
    option = {
        tooltip: {
            trigger: 'item',
            formatter: "{a} <br/>{b}: {c} ({d}%)"
        },
        legend: {
            orient: 'vertical',
            x: 'right',
            data: ['北斗一号', '北斗二号', '北斗三号', '测控', '遥感', '其他'],
            // itemWidth: 50,
            // itemHeight: 25
        },
        series: [{
            name: '访问来源',
            type: 'pie',
            radius: ['50%', '70%'],
            avoidLabelOverlap: false,
            label: {
                normal: {
                    show: false,
                    position: 'center'
                },
                emphasis: {
                    show: true,
                    textStyle: {
                        fontSize: '30',
                        fontWeight: 'bold'
                    }
                }
            },
            labelLine: {
                normal: {
                    show: false
                }
            },
            data: [{
                    value: 36,
                    name: '北斗一号',
                    itemStyle: {
                        normal: {
                            color: '#FF79BE'
                        }
                    },
                },
                {
                    value: 20,
                    name: '北斗二号',
                    itemStyle: {
                        normal: {
                            color: '#E5ADFA'
                        }
                    },
                },
                {
                    value: 36,
                    name: '北斗三号',
                    itemStyle: {
                        normal: {
                            color: '#87DACE'
                        }
                    },
                },
                {
                    value: 36,
                    name: '测控',
                    itemStyle: {
                        normal: {
                            color: '#5D87F6'
                        }
                    },
                },
                {
                    value: 9,
                    name: '遥感',
                    itemStyle: {
                        normal: {
                            color: '#5DB2FA'
                        }
                    },
                },
                {
                    value: 9,
                    name: '其他',
                    itemStyle: {
                        normal: {
                            color: '#FFAD49'
                        }
                    },
                }
            ]
        }]
    };

    // 使用刚指定的配置项和数据显示图表。
    myChart.setOption(option);
}
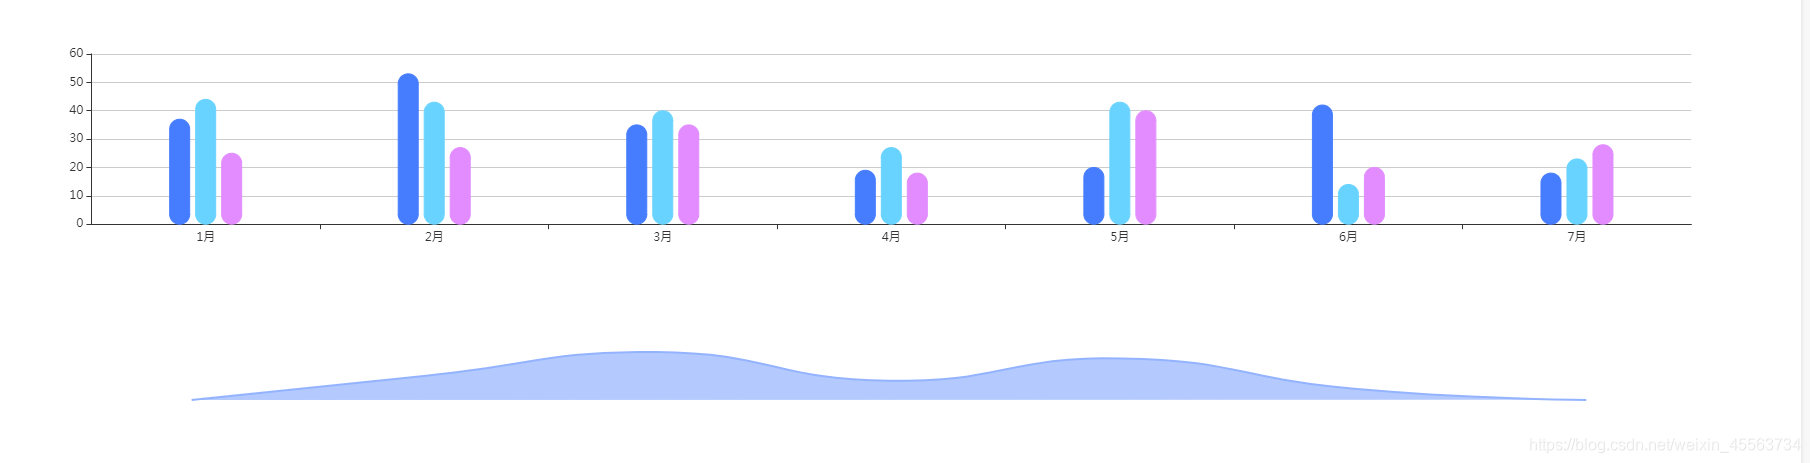
柱状图和面积图
<div class="trendAnaysis-up" id="trendAnaysisBar"></div>
<div class="trendAnaysis-down" id="trendAnaysisLine"></div>


//初始化总体工作趋势分析的柱状图和面积图
function initTrendAnaysis() {

    myChart = echarts.init(document.getElementById('trendAnaysisBar'));

    option = {
        tooltip: {
            trigger: 'axis',
            axisPointer: { // 坐标轴指示器,坐标轴触发有效
                type: 'shadow' // 默认为直线,可选为:'line' | 'shadow'
            }
        },
        legend: {
            data: ['计划测试数', '实际执行数', '异常提交数'],
            padding: [310, 200, 0, 0]
        },
        grid: {
            left: '3%',
            right: '4%',
            bottom: '10%',
            containLabel: true
        },
        xAxis: [{
            type: 'category',
            data: ['1月', '2月', '3月', '4月', '5月', '6月', '7月']
        }],
        yAxis: [{
            type: 'value'
        }],
        series: [{
                name: '计划测试数',
                type: 'bar',
                data: [37, 53, 35, 19, 20, 42, 18],
                barWidth: 20,
                itemStyle: {
                    normal: {
                        color: '#467DFF', // 折线条的颜色
                        borderColor: '#467DFF', // 拐点边框颜色
                        barBorderRadius: 10
                    },
                }
            },
            {
                name: '实际执行数',
                type: 'bar',
                data: [44, 43, 40, 27, 43, 14, 23],
                barWidth: 20,
                itemStyle: {
                    normal: {
                        color: '#69D3FF', // 折线条的颜色
                        borderColor: '#69D3FF', // 拐点边框颜色
                        barBorderRadius: 10
                    }
                }
            },
            {
                name: '异常提交数',
                type: 'bar',
                data: [25, 27, 35, 18, 40, 20, 28],
                barWidth: 20,
                itemStyle: {
                    normal: {
                        color: '#E28CFF', // 折线条的颜色
                        borderColor: '#E28CFF', // 拐点边框颜色
                        barBorderRadius: 10
                    }
                }
            }
        ]
    };

    myChart.setOption(option);

    //下面的面积图
    myChart = echarts.init(document.getElementById('trendAnaysisLine'));
    // 指定图表的配置项和数据
    option = {
        tooltip: {
            trigger: 'axis',
            axisPointer: { // 坐标轴指示器,坐标轴触发有效
                type: 'shadow' // 默认为直线,可选为:'line' | 'shadow'
            }
        },
        xAxis: {
            type: 'category',
            boundaryGap: false,
            data: ['2019.01.01', '2019.02.12', '2019.03.03', '2019.04.16', '2019.05.20', '2019.06.08', '2019.07.31'],
            show: false
        },
        yAxis: {
            type: 'value',
            show: false
        },
        series: [{
            data: [0, 15, 30, 12, 26, 7, 0],
            type: 'line',
            smooth: true,
            symbol: 'circle', // 拐点类型
            symbolSize: 0,
            areaStyle: {
                normal: {
                    color: '#94B3FF' //改变区域颜色
                }
            },
            itemStyle: {
                normal: {
                    color: '#94B3FF', //改变折线点的颜色
                    lineStyle: {
                        color: '#94B3FF' //改变折线颜色
                    }
                }
            },
        }]
    };
    // 使用刚指定的配置项和数据显示图表。
    myChart.setOption(option);
}
