> library(lattice)
Warning message:
程辑包‘lattice’是用R版本3.4.3 来建造的
> library(caret)
载入需要的程辑包:ggplot2
Warning messages:
1: 程辑包‘caret’是用R版本3.4.3 来建造的
2: 程辑包‘ggplot2’是用R版本3.4.3 来建造的
> library(dplyr)

载入程辑包:‘dplyr’

The following objects are masked from ‘package:stats’:

    filter, lag

The following objects are masked from ‘package:base’:

    intersect, setdiff, setequal, union

Warning message:
程辑包‘dplyr’是用R版本3.4.3 来建造的
> library(elasticnet)
载入需要的程辑包:lars
Loaded lars 1.2

> library(lars)
> sim.dat=read.csv("https://raw.githubusercontent.com/happyrabbit/DataScientistR/master/Data/SegData.csv")
>
> ymad=mad(na.omit(sim.dat$income))
>
> zs=(sim.dat$income-mean(na.omit(sim.dat$income)))/ymad
>
> idex=c(which(na.omit(zs>3.5)),which(is.na(zs)))
>
> sim.dat=sim.dat[-idex,]
>
> xtrain=dplyr::select(sim.dat,Q1:Q10)
>
> ytrain=sim.dat$income
>
> set.seed(100)
>
> ctr1=trainControl(method="cv",number=10)
>
> plsTune=train(xtrain,ytrain,method="pls",tuneGrid=expand.grid(.ncomp=1:10))
>
> plsTune=train(xtrain,ytrain,method="pls",tuneGrid=expand.grid(.ncomp=1:10),trControl=ctr1)
>
> pluTune
Error: object 'pluTune' not found
> plsTune
Partial Least Squares

772 samples
 10 predictor

No pre-processing
Resampling: Cross-Validated (10 fold)
Summary of sample sizes: 694, 696, 696, 696, 694, 695, ...
Resampling results across tuning parameters:

  ncomp  RMSE      Rsquared   MAE
   1     28106.40  0.6553646  19957.91
   2     24852.89  0.7385908  16142.37
   3     23594.19  0.7679501  14507.19
   4     23442.31  0.7713064  13940.47
   5     23407.49  0.7721321  13848.48
   6     23409.49  0.7720994  13838.38
   7     23408.15  0.7721470  13835.54
   8     23408.56  0.7721433  13835.52
   9     23408.46  0.7721447  13835.46
  10     23408.46  0.7721448  13835.48

RMSE was used to select the optimal model using the smallest value.
The final value used for the model was ncomp = 5.
> plot(plsImp,top=10,scales=list(y=list(cex=.95)))
可以看到,Q1Q2,Q3的重要性明显高于其他变量
下面我们对主成分回归进行调优,调优参数依旧是模型中成分的数目
> set.seed(100)
> pcrTune=train(x=xtrain,y=ytrain,method="pcr",tuneGrid=expand.grid(.ncomp=1:10),trControl=ctr1)
> pcrTune
Principal Component Analysis

772 samples
 10 predictor

No pre-processing
Resampling: Cross-Validated (10 fold)
Summary of sample sizes: 696, 693, 694, 694, 696, 695, ...
Resampling results across tuning parameters:

  ncomp  RMSE      Rsquared    MAE
   1     45957.59  0.03243035  36598.90
   2     32459.79  0.52199913  24040.87
   3     23235.11  0.75774323  14515.67
   4     23262.34  0.75735221  14545.16
   5     23152.29  0.75956717  14231.64
   6     23133.20  0.76003827  14130.41
   7     23113.93  0.76048652  14128.53
   8     23114.64  0.76045268  14129.77
   9     22991.03  0.76283052  13801.16
  10     22976.35  0.76308486  13726.14

RMSE was used to select the optimal model using the smallest value.
The final value used for the model was ncomp = 10.
> plsResamples=plsTune$results
> plsResamples$Model="PLS"
> pcrResamples=pcrTune$results
> pcrResamples$Model="PCR"
> plsPlotData=rbind(plsResamples,pcrResamples)
> xyplot(RMSE~ncomp,data=plsPlotData,xlab="# Components",ylab="RMSE (Cross-Validation)",auto.key=list(columns=2),groups=Model,type=c("o","g"))
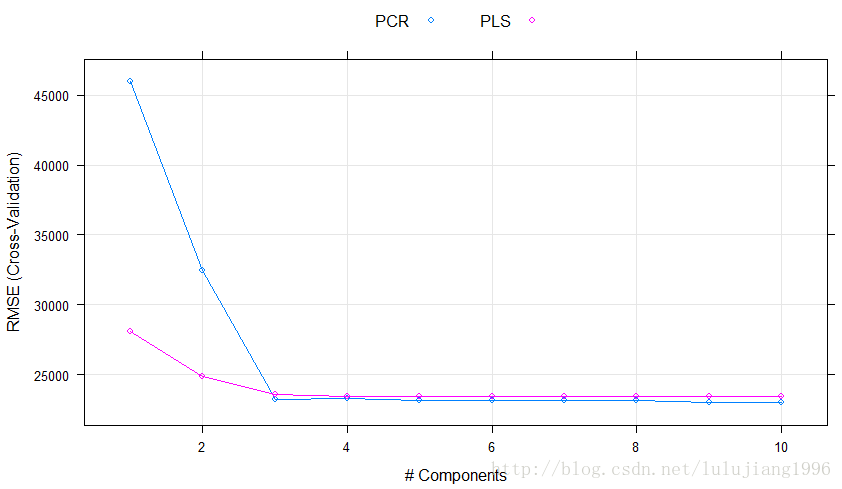
如上,图形表明:用前3个成分给出的模型效果和用更多成分给出的模型效果依旧没有太大差别了。