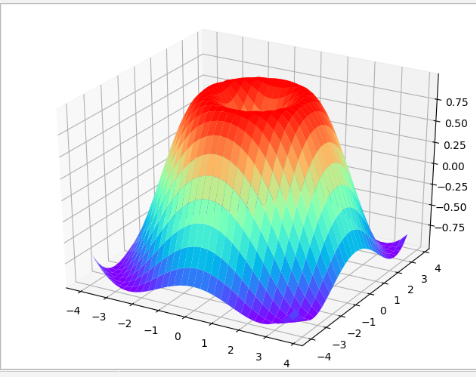
效果图:
代码:
 1 from matplotlib import pyplot as plt
 2 import numpy as np
 3 from mpl_toolkits.mplot3d import Axes3D
 4     fig = plt.figure()
 5     ax = Axes3D(fig)
 6     X = np.arange(-4, 4, 0.25)
 7     Y = np.arange(-4, 4, 0.25)
 8     X, Y = np.meshgrid(X, Y)
 9     R = np.sqrt(X ** 2 + Y ** 2)
10     Z = np.sin(R)
11     ax.plot_surface(X, Y, Z, rstride=1, cstride=1, cmap='rainbow')
12     plt.show()