概念
直接生成多张图片
- 面向对象
import numpy as np
import matplotlib.pyplot as plt
fig1 = plt.figure()
ax1 = fig1.add_subplot(111)
ax1.plot([1, 2, 3], [3, 2, 1])
fig2 = plt.figure()
ax2 = fig2.add_subplot(111)
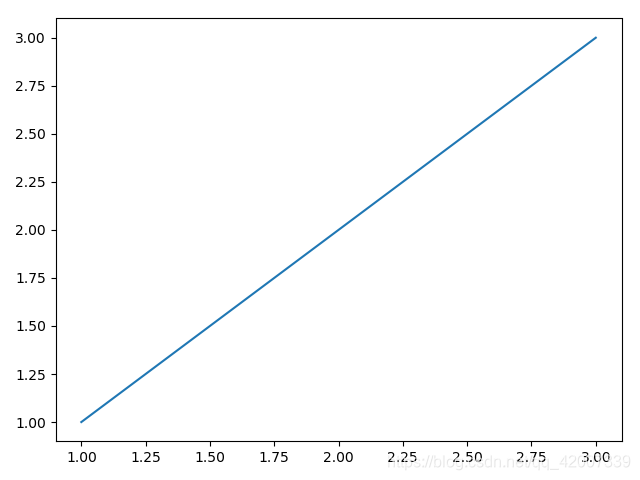
ax2.plot([1, 2, 3], [1, 2, 3])
plt.show()
#输出两个图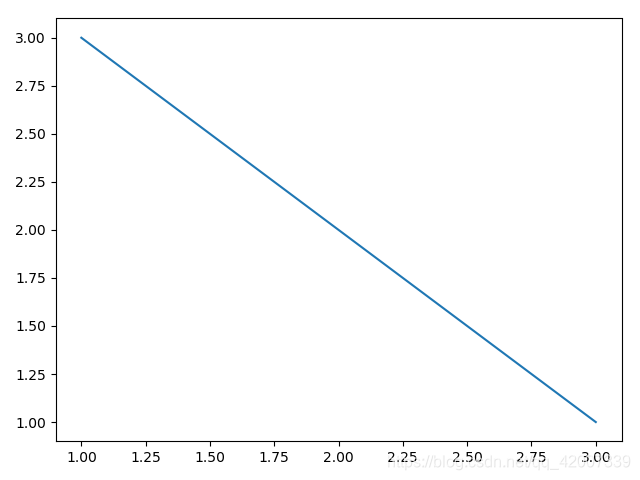
直接生成多张图片
import numpy as np
import matplotlib.pyplot as plt
fig1 = plt.figure()
ax1 = fig1.add_subplot(111)
ax1.plot([1, 2, 3], [3, 2, 1])
fig2 = plt.figure()
ax2 = fig2.add_subplot(111)
ax2.plot([1, 2, 3], [1, 2, 3])
plt.show()
#输出两个图