1.首先要绘制一个简单的条形图
import numpy as np
import matplotlib.pyplot as plt
from matplotlib import mlab
from matplotlib import rcParams
fig1 = plt.figure(2)
rects =plt.bar(left = (0.2,1),height = (1,0.5),width = 0.2,align="center",yerr=0.000001)
plt.title('Pe')
plt.show()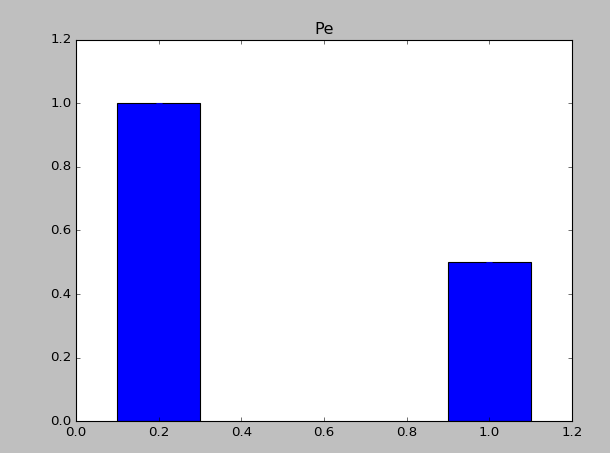
2.增加直方图脚注
import numpy as np
import matplotlib.pyplot as plt
from matplotlib import mlab
from matplotlib import rcParams
fig1 = plt.figure(2)
rects =plt.bar(left = (0.2,1),height = (1,0.5),width = 0.2,align="center",yerr=0.000001)
plt.title('Pe')
plt.xticks((0.2,1),('frst','second'))
plt.show() 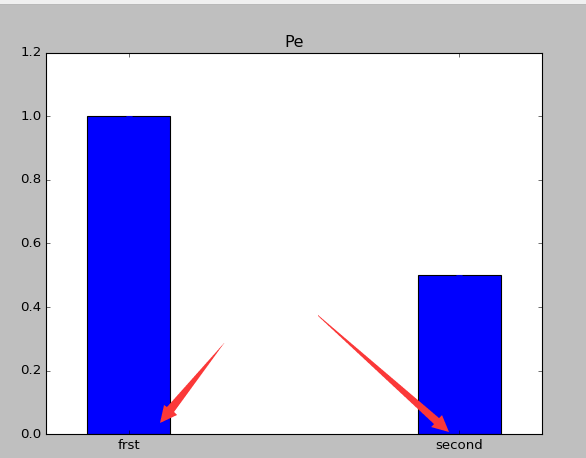
3.条形图上显示具体的数字(自动编号)
import numpy as np
import matplotlib.pyplot as plt
from matplotlib import mlab
from matplotlib import rcParams
fig1 = plt.figure(2)
rects =plt.bar(left = (0.2,1),height = (1,0.5),width = 0.2,align="center",yerr=0.000001)
plt.title('Pe')
def autolabel(rects):
  for rect in rects:
    height = rect.get_height()
    plt.text(rect.get_x()+rect.get_width()/2., 1.03*height, '%s' % float(height))
autolabel(rects)
plt.xticks((0.2,1),('frst','second'))
plt.show() 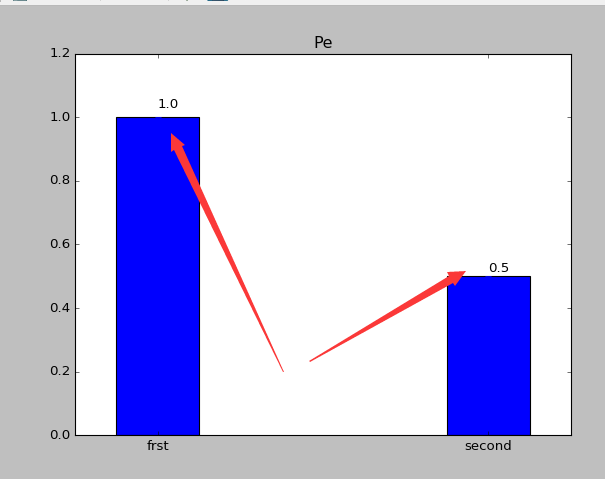
4.改变颜色
import numpy as np
import matplotlib.pyplot as plt
from matplotlib import mlab
from matplotlib import rcParams
fig1 = plt.figure(2)
rects =plt.bar(left = (0.2,1),height = (1,0.5),color=('r','g'),width = 0.2,align="center",yerr=0.000001)
plt.title('Pe')
def autolabel(rects):
  for rect in rects:
    height = rect.get_height()
    plt.text(rect.get_x()+rect.get_width()/2., 1.03*height, '%s' % float(height))
autolabel(rects)
plt.xticks((0.2,1),('frst','second'))
plt.show() 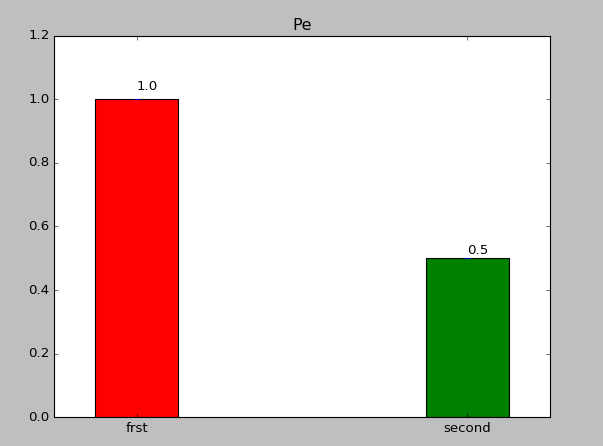
5.添加图注
import numpy as np
import matplotlib.pyplot as plt
from matplotlib import mlab
from matplotlib import rcParams
fig1 = plt.figure(2)
rects1 =plt.bar(left = (0.2),height = (0.5),color=('g'),label=(('no1')),width = 0.2,align="center",yerr=0.000001)
rects2 =plt.bar(left = (1),height = (1),color=('r'),label=(('no2')),width = 0.2,align="center",yerr=0.000001)
plt.legend()
plt.xticks((0.2,1),('frst','second'))
plt.title('Pe')

def autolabel(rects):
  for rect in rects:
    height = rect.get_height()
    plt.text(rect.get_x()+rect.get_width()/2., 1.03*height, '%s' % float(height))
autolabel(rects1)
autolabel(rects2)
plt.show() 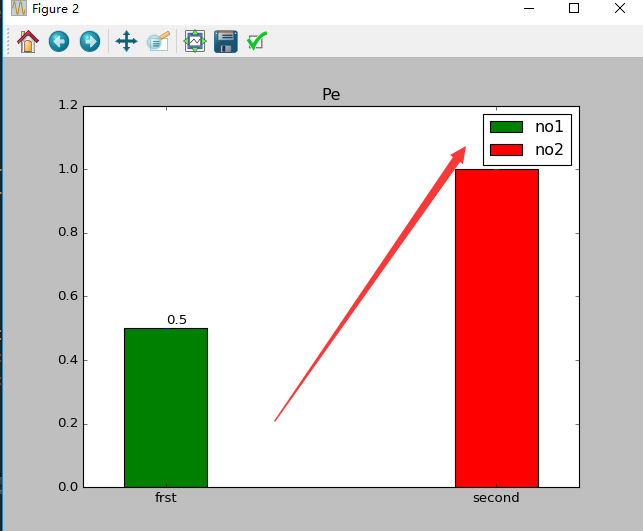
6.其他
example1
import numpy as np
import matplotlib.pyplot as plt

N = 5
y1 = [20, 10, 30, 25, 15]
y2 = [15, 14, 34 ,10,5]
index = np.arange(5)

bar_width = 0.3
plt.bar(index , y1, width=0.3 , color='r')
plt.bar(index +  bar_width, y2, width=0.3 , color='g')
plt.show()
example2
import numpy as np
import matplotlib.pyplot as plt

N = 5
y1 = [20, 10, 30, 25, 15]
y2 = [15, 14, 34 ,10,5]
index = np.arange(5)

bar_width = 0.3
plt.bar(index , y1, width=0.3 , color='r')
plt.bar(index , y2, width=0.3 , color='g' ,bottom=y1)
plt.show()