Email configuration
我们这里选择 email 告警,首先修改 grafana 的配置文件 /etc/grafana/grafana.ini,找到 SMTP 部分,修改为如下:
[smtp]
;enabled = false
enabled = true
;host = localhost:25
host = smtp.exmail.qq.com:25
;user =
user = [email protected]
# If the password contains # or ; you have to wrap it with triple quotes. Ex """#password;"""
;password =
password = Q7P1hsdfsenzzyM
;cert_file =
;key_file =
;skip_verify = false
;from_address = [email protected]
from_address = [email protected]
from_name = Grafana
# EHLO identity in SMTP dialog (defaults to instance_name)
;ehlo_identity = dashboard.example.com
修改完成后,重启 grafana。
Notification channels
登陆到 grafana 中,创建一个通知渠道,测试一下,看看是否收到邮件。
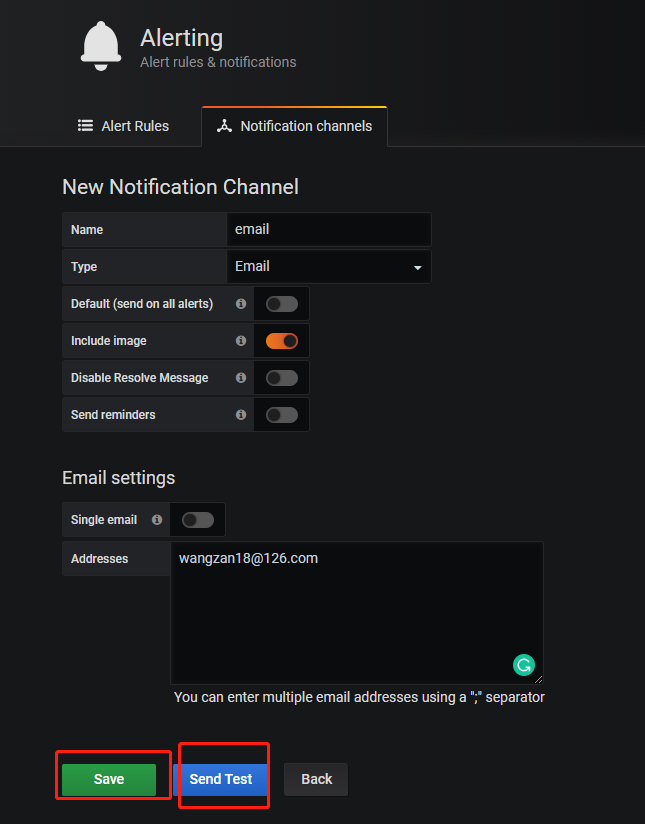
- Name - Enter a name for this channel. It will be displayed when users add notifications to alert rules.
- Type - Select the channel type. Refer to the List of supported notifiers for details.
- Default (send on all alerts) - When selected, this option sends a notification on this channel for all alert rules.
- Include Image - See Enable images in notifications for details.
- Disable Resolve Message - When selected, this option disables the resolve message [OK] that is sent when the alerting state returns to false.
- Send reminders - When this option is checked additional notifications (reminders) will be sent for triggered alerts. You can specify how often reminders should be sent using number of seconds (s), minutes (m) or hours (h), for example
30s,3m,5mor1h.
Create alerts
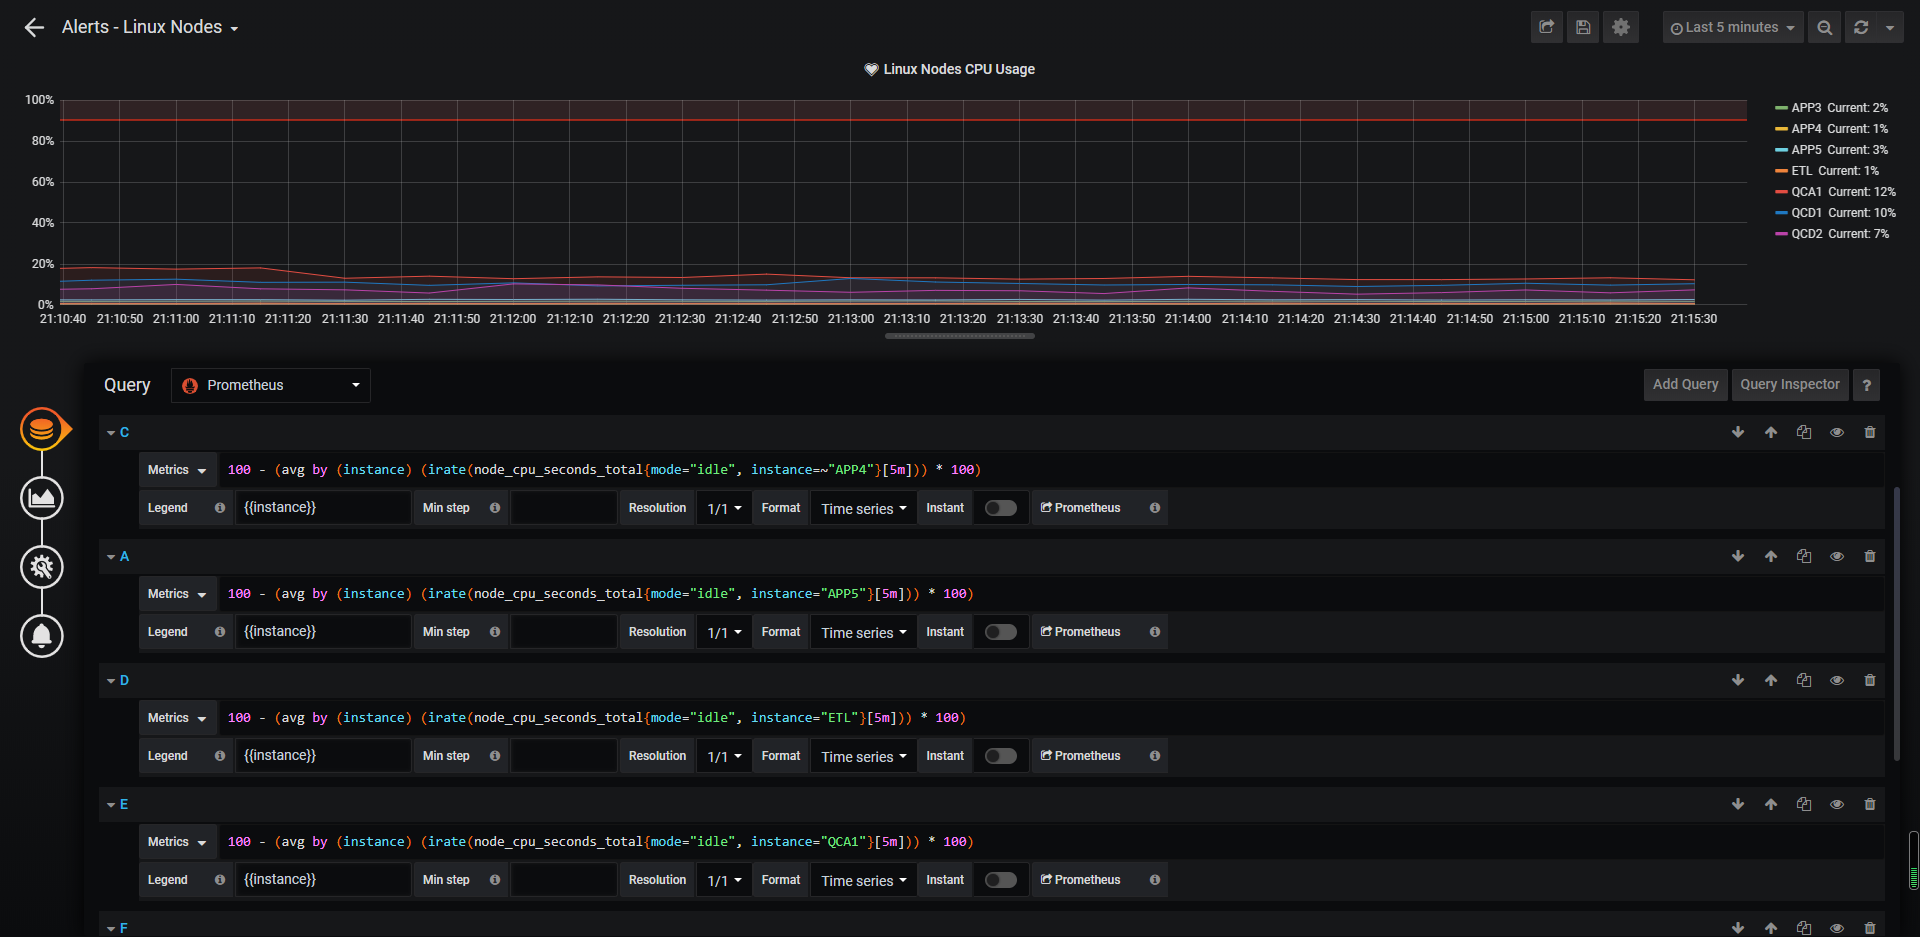
grafana 不支持带有变量的模板报警,所以我们需要创建一个不带有变量的模板,这个我们可以去官方的 dashboard 中找一个,我这里找到编号为5984,大家可以安装这个模板。
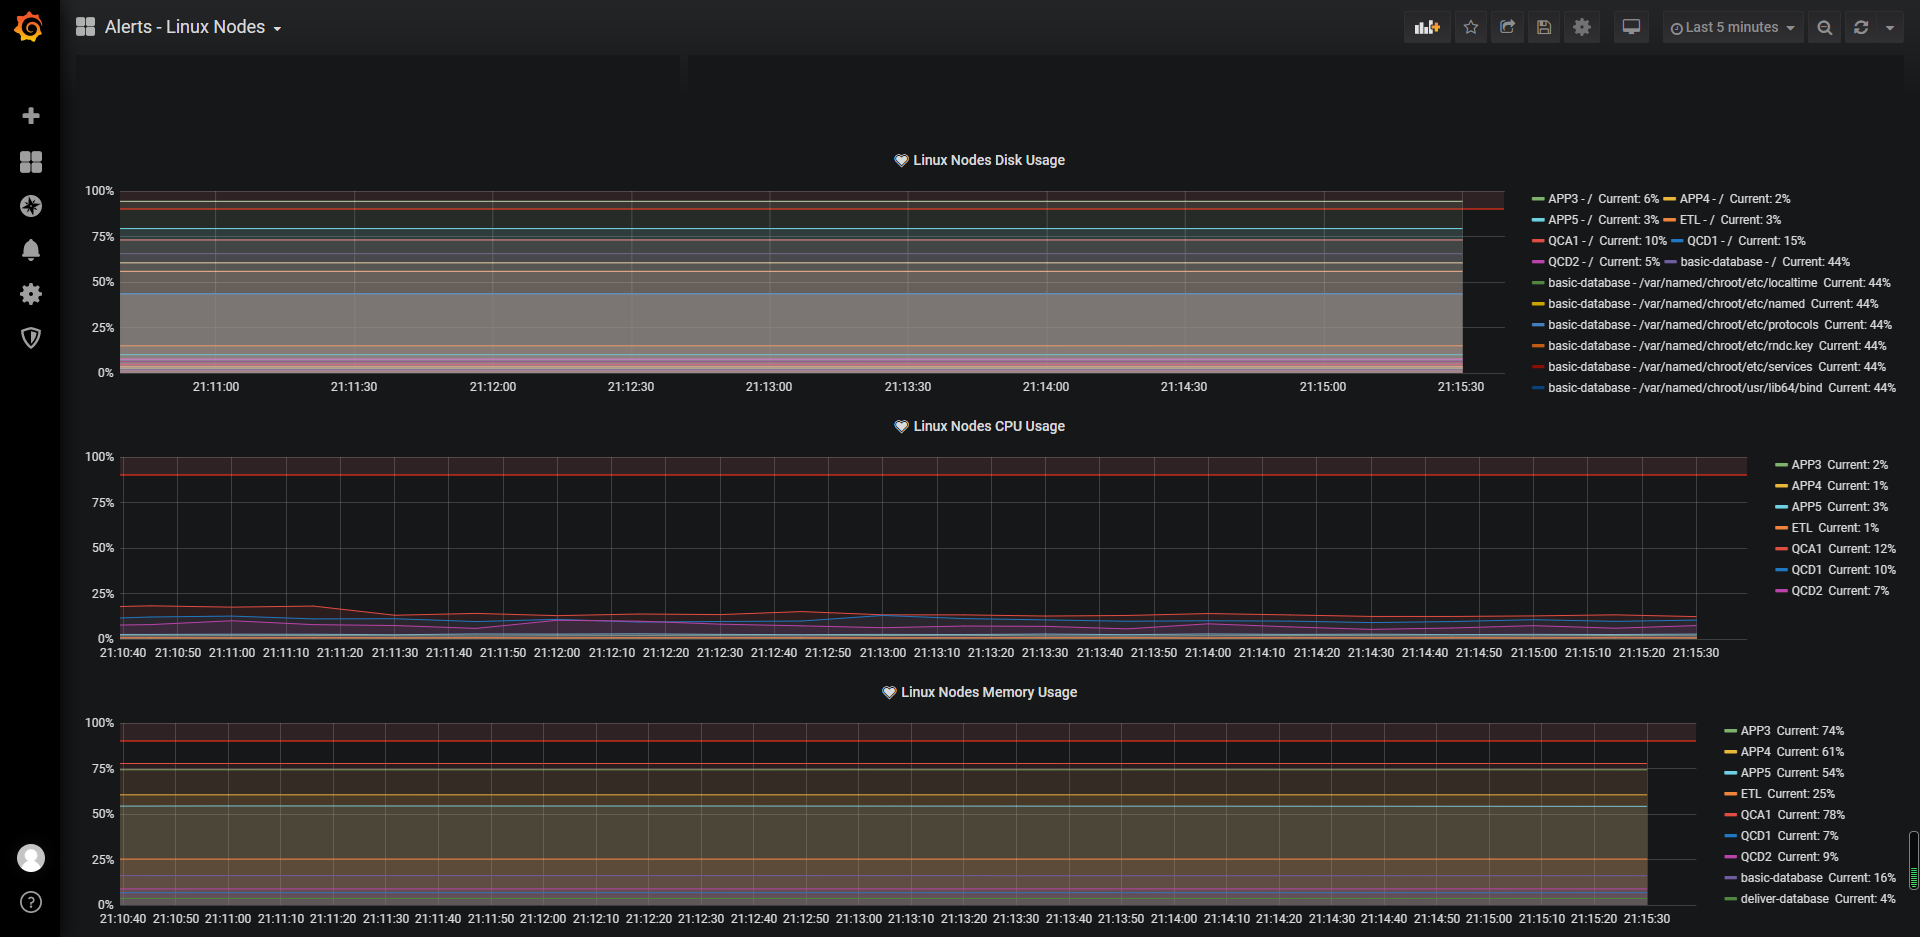
我在里面简单修改了一下格式,以及数据源,主要是针对 CPU 的负载修改了一下,其他资源默认可以使用。
欢迎大家扫码关注,获取更多信息