一、下载依赖
npm install echarts --save
npm install ngx-echarts --save
二、在angular.json里找到script配置一下
"scripts": [
"node_modules/echarts/dist/echarts.js"
]
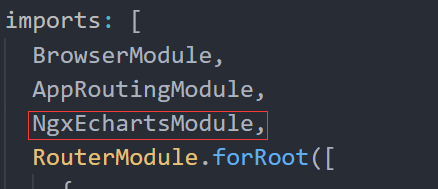
三、在app.module.ts里引用
import { NgxEchartsModule } from 'ngx-echarts';
四、准备一个容器
<div echarts [options]="chartOption" style="width: 70%;height: 500px;"></div>
五、创建图表对象
export class OneComponent implements OnInit {
  constructor() { }
  ngOnInit() {
  }
  chartOption = {
      title: {
          text: 'ECharts 入门示例'
      },
      tooltip: {},
      legend: {
          data:['销量']
      },
      xAxis: {
          data: ["衬衫","羊毛衫","雪纺衫","裤子","高跟鞋","袜子"]
      },
      yAxis: {},
      series: [{
          name: '销量',
          type: 'bar',
          data: [5, 20, 36, 10, 10, 20]
      }]
  };
}