1 Ganglia 的安装与部署
1) 安装 httpd 服务与 php
[atguigu@hadoop102 flume]$ sudo yum -y install httpd php
2) 安装其他依赖
[atguigu@hadoop102 flume]$ sudo yum -y install rrdtool
perl-rrdtool rrdtool-devel
[atguigu@hadoop102 flume]$ sudo yum -y install apr-devel
3) 安装 ganglia
[atguigu@hadoop102 flume]$ sudo rpm -Uvh
http://dl.fedoraproject.org/pub/epel/6/x86_64/epel-release-6-8
.noarch.rpm
[atguigu@hadoop102 flume]$ sudo yum -y install ganglia-gmetad
[atguigu@hadoop102 flume]$ sudo yum -y install ganglia-web
[atguigu@hadoop102 flume]$ sudo yum install -y ganglia-gmond
4) 修改配置文件/etc/httpd/conf.d/ganglia.conf
[atguigu@hadoop102 flume]$ sudo vim /etc/httpd/conf.d/ganglia.conf
修改为红颜色的配置:
# Ganglia monitoring system php web frontend
Alias /ganglia /usr/share/ganglia
<Location /ganglia>
 Order deny,allow
 Deny from all
 Allow from all
 # Allow from 127.0.0.1
 # Allow from ::1
 # Allow from .example.com
</Location>
5) 修改配置文件/etc/ganglia/gmetad.conf
[atguigu@hadoop102 flume]$ sudo vim /etc/ganglia/gmetad.conf
修改为:
data_source "hadoop102" 192.168.1.102
6) 修改配置文件/etc/ganglia/gmond.conf
[atguigu@hadoop102 flume]$ sudo vim /etc/ganglia/gmond.conf
修改为:
cluster {
 name = "hadoop102"
 owner = "unspecified"
 latlong = "unspecified"
 url = "unspecified"
}
udp_send_channel {
 #bind_hostname = yes # Highly recommended, soon to be default.
 # This option tells gmond to use a source
address
 # that resolves to the machine's hostname.
Without
 # this, the metrics may appear to come from any
 # interface and the DNS names associated with
 # those IPs will be used to create the RRDs.
# mcast_join = 239.2.11.71
host = 192.168.1.102
 port = 8649
 ttl = 1
}
udp_recv_channel {
 # mcast_join = 239.2.11.71
 port = 8649
 bind = 192.168.1.102
 retry_bind = true
 # Size of the UDP buffer. If you are handling lots of metrics
you really
 # should bump it up to e.g. 10MB or even higher.
 # buffer = 10485760
}
7) 修改配置文件/etc/selinux/config
[atguigu@hadoop102 flume]$ sudo vim /etc/selinux/config
修改为:
# This file controls the state of SELinux on the system.
# SELINUX= can take one of these three values:
# enforcing - SELinux security policy is enforced.
# permissive - SELinux prints warnings instead of enforcing.
# disabled - No SELinux policy is loaded.
SELINUX=disabled
# SELINUXTYPE= can take one of these two values:
# targeted - Targeted processes are protected,
# mls - Multi Level Security protection.
SELINUXTYPE=targeted
尖叫提示:selinux 本次生效关闭必须重启,如果此时不想重启,可以临时生效之:
[atguigu@hadoop102 flume]$ sudo setenforce 0
5) 启动 ganglia
[atguigu@hadoop102 flume]$ sudo service httpd start
[atguigu@hadoop102 flume]$ sudo service gmetad start
[atguigu@hadoop102 flume]$ sudo service gmond start
6) 打开网页浏览 ganglia 页面
http://192.168.1.102/ganglia
尖叫提示:如果完成以上操作依然出现权限不足错误,请修改/var/lib/ganglia 目录的权限:
[atguigu@hadoop102 flume]$ sudo chmod -R 777 /var/lib/ganglia
2 操作 Flume 测试监控
1) 修改/opt/module/flume/conf 目录下的 flume-env.sh 配置:
JAVA_OPTS="-Dflume.monitoring.type=ganglia
-Dflume.monitoring.hosts=192.168.1.102:8649
-Xms100m
-Xmx200m"
2) 启动 Flume 任务
[atguigu@hadoop102 flume]$ bin/flume-ng agent \
--conf conf/ \
--name a1 \
--conf-file job/flume-telnet-logger.conf \ -Dflume.root.logger==INFO,console \ -Dflume.monitoring.type=ganglia \ -Dflume.monitoring.hosts=192.168.1.102:8649
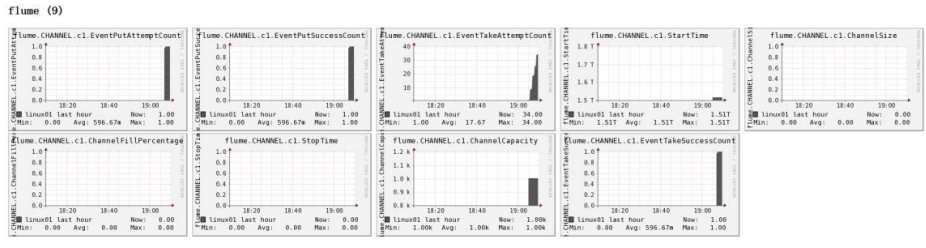
3) 发送数据观察 ganglia 监测图
[atguigu@hadoop102 flume]$ telnet localhost 44444
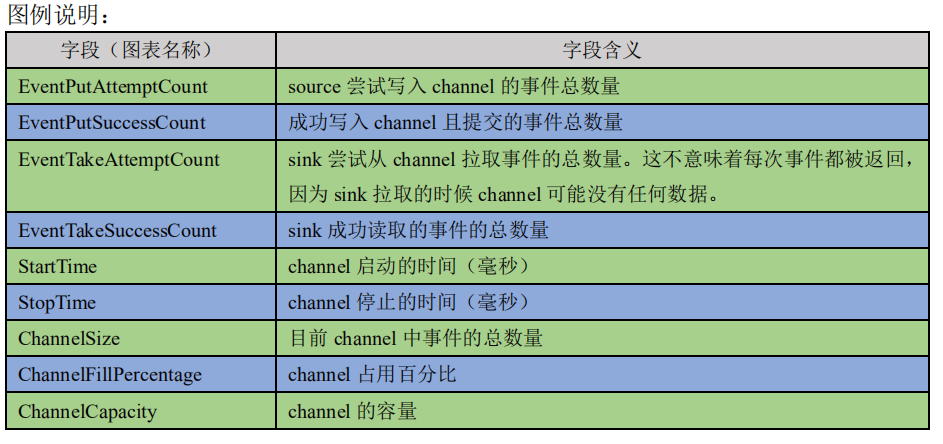
样式如图: