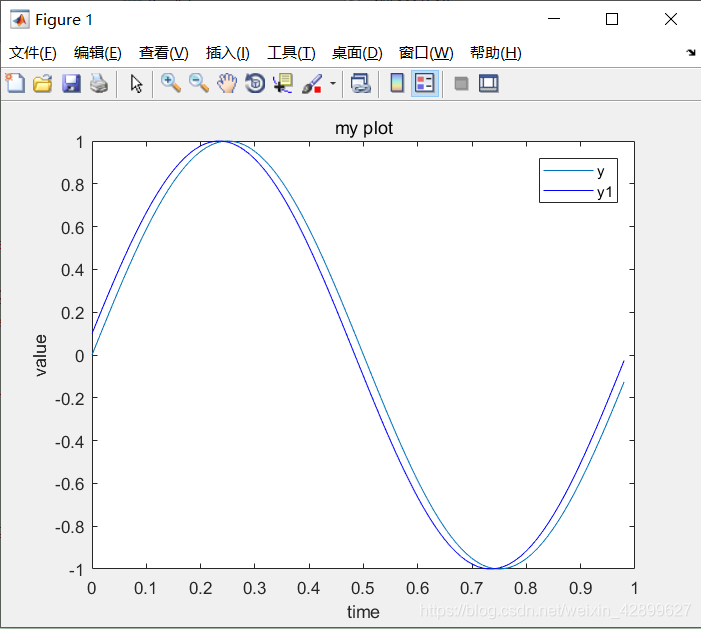
hold on %保持原来的图像
y1=sin(2*pi*x+0.1)plot(x,y1,'b')%在原来的图上添加新图,用蓝色画线
xlabel('time')%添加横轴标签
ylabel('value')%添加纵轴标签
legend('y','y1')%给曲线添加标签
title('my plot')%给图像添加标题
print -dpng 'myplot.png'%保存图片,名称为“myplot.png”
close %关闭图像
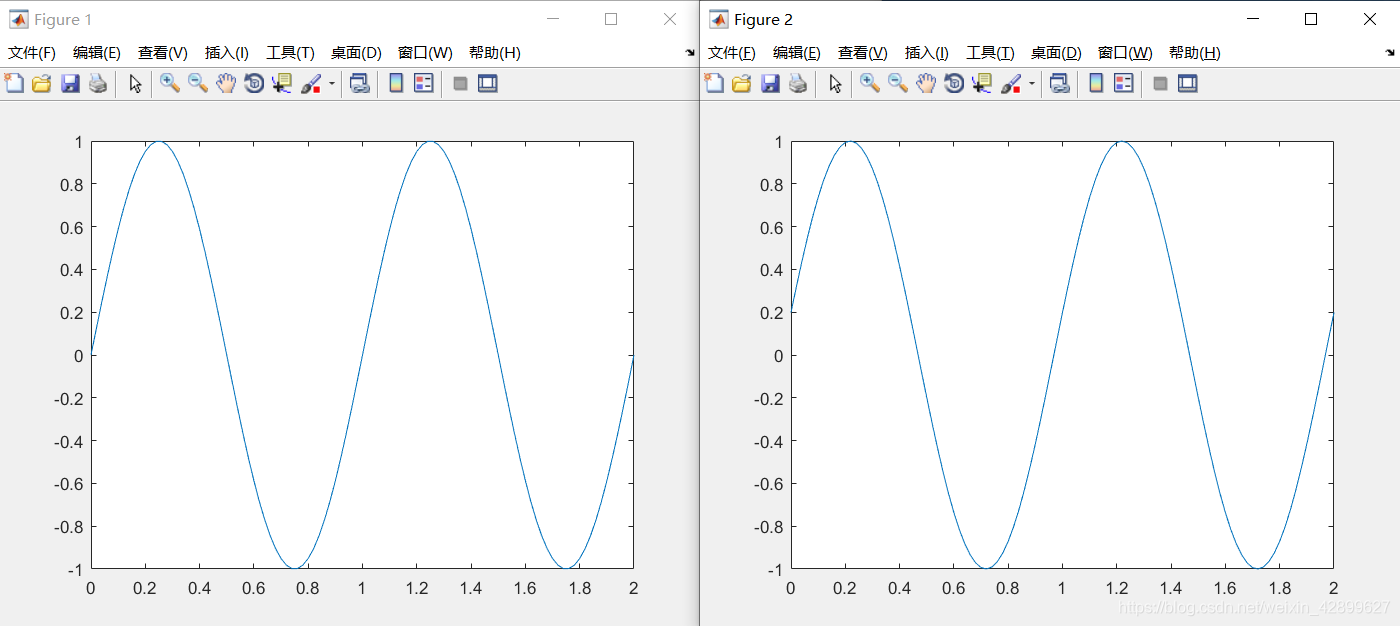
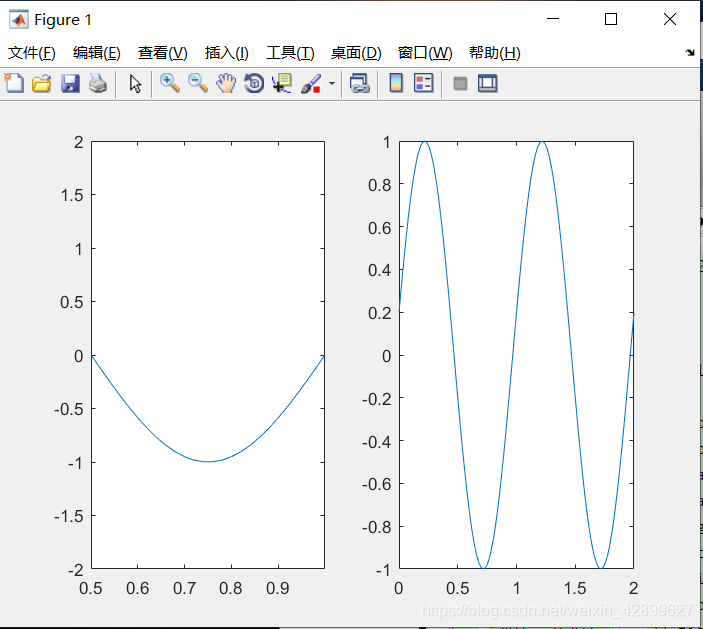
figure(1);plot(b,y)figure(2);plot(b,y1)
close
close