#-*-coding:utf-8-*-
import numpy as np
import matplotlib.pyplot as plt
from data_utils import load_CIFAR10
cifar10_dir = 'datasets/cifar-10-batches-py'
X_train, y_train, X_test, y_test = load_CIFAR10(cifar10_dir)
print("训练数据:",X_train.shape)
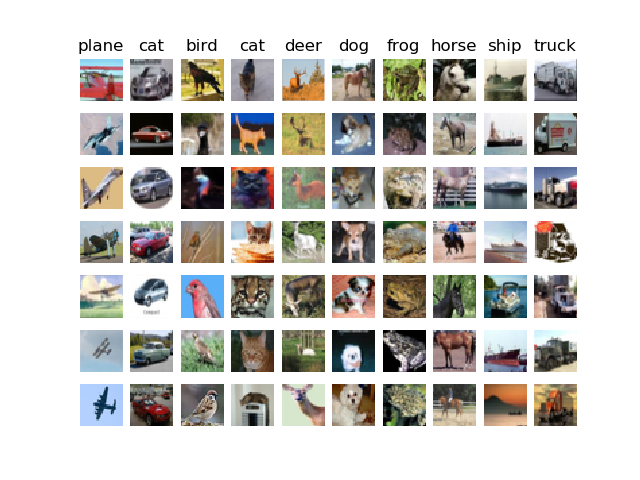
classes = ['plane', 'cat', 'bird', 'cat', 'deer', 'dog', 'frog', 'horse', 'ship', 'truck']
num_classes = len(classes)
samples_per_class = 7
for y,cls in enumerate(classes):
idxs = np.flatnonzero(y_train == y)
idxs = np.random.choice(idxs,samples_per_class, replace=False)
for i, idx in enumerate(idxs):
plt_idx = i * num_classes + y + 1
plt.subplot(samples_per_class, num_classes, plt_idx)
plt.imshow(X_train[idx].astype('uint8'))
plt.axis('off')
if i == 0:
plt.title(cls)
plt.show()