前言
在写论文时,遇到需要放大局部曲线的情景,故而百度寻找答案。现将结果记录于笔记中,方便日后直接查找使用。
一 准备
- matlab软件
- 新建
magnify.m文件,并将下列代码复制到magnify.m文件中。
function magnify(f1)
%
%magnify(f1)
%
%  Figure creates a magnification box when under the mouse
%  position when a button is pressed.  Press '+'/'-' while
%  button pressed to increase/decrease magnification. Press
%  '>'/'<' while button pressed to increase/decrease box size.
%  Hold 'Ctrl' while clicking to leave magnification on figure.
%
%  Example:
%     plot(1:100,randn(1,100),(1:300)/3,rand(1,300)), grid on,
%     magnify;

% Rick Hindman - 7/29/04

if (nargin == 0), f1 = gcf; end;
set(f1, ...
   'WindowButtonDownFcn',  @ButtonDownCallback, ...
   'WindowButtonUpFcn', @ButtonUpCallback, ...
   'WindowButtonMotionFcn', @ButtonMotionCallback, ...
   'KeyPressFcn', @KeyPressCallback);
return;

function ButtonDownCallback(src,eventdata)
   f1 = src;
   a1 = get(f1,'CurrentAxes');
   a2 = copyobj(a1,f1);

   set(f1, ...
      'UserData',[f1,a1,a2], ...
      'Pointer','fullcrosshair', ...
      'CurrentAxes',a2);
   set(a2, ...
      'UserData',[2,0.2], ...  %magnification, frame size
      'Color',get(a1,'Color'), ...
      'Box','on');
   xlabel(''); ylabel(''); zlabel(''); title('');
   set(get(a2,'Children'), ...
      'LineWidth', 2);
   set(a1, ...
      'Color',get(a1,'Color')*0.95);
   set(f1, ...
      'CurrentAxes',a1);
   ButtonMotionCallback(src);
return;

function ButtonUpCallback(src,eventdata)
   H = get(src,'UserData');
   f1 = H(1); a1 = H(2); a2 = H(3);
   set(a1, ...
      'Color',get(a2,'Color'));
   set(f1, ...
      'UserData',[], ...
      'Pointer','arrow', ...
      'CurrentAxes',a1);
   if ~strcmp(get(f1,'SelectionType'),'alt'),
      delete(a2);
   end;
return;

function ButtonMotionCallback(src,eventdata)
   H = get(src,'UserData');
   if ~isempty(H)
      f1 = H(1); a1 = H(2); a2 = H(3);
      a2_param = get(a2,'UserData');
      f_pos = get(f1,'Position');
      a1_pos = get(a1,'Position');

      [f_cp, a1_cp] = pointer2d(f1,a1);

      set(a2,'Position',[(f_cp./f_pos(3:4)) 0 0]+a2_param(2)*a1_pos(3)*[-1 -1 2 2]);
      a2_pos = get(a2,'Position');

   	set(a2,'XLim',a1_cp(1)+(1/a2_param(1))*(a2_pos(3)/a1_pos(3))*diff(get(a1,'XLim'))*[-0.5 0.5]);
   	set(a2,'YLim',a1_cp(2)+(1/a2_param(1))*(a2_pos(4)/a1_pos(4))*diff(get(a1,'YLim'))*[-0.5 0.5]);
   end;
return;

function KeyPressCallback(src,eventdata)
   H = get(gcf,'UserData');
   if ~isempty(H)
      f1 = H(1); a1 = H(2); a2 = H(3);
      a2_param = get(a2,'UserData');
      if (strcmp(get(f1,'CurrentCharacter'),'+') | strcmp(get(f1,'CurrentCharacter'),'='))
         a2_param(1) = a2_param(1)*1.2;
      elseif (strcmp(get(f1,'CurrentCharacter'),'-') | strcmp(get(f1,'CurrentCharacter'),'_'))
         a2_param(1) = a2_param(1)/1.2;
      elseif (strcmp(get(f1,'CurrentCharacter'),'<') | strcmp(get(f1,'CurrentCharacter'),','))
         a2_param(2) = a2_param(2)/1.2;
      elseif (strcmp(get(f1,'CurrentCharacter'),'>') | strcmp(get(f1,'CurrentCharacter'),'.'))
         a2_param(2) = a2_param(2)*1.2;
      end;
      set(a2,'UserData',a2_param);
   	ButtonMotionCallback(src);
   end;
return;


% Included for completeness (usually in own file)
function [fig_pointer_pos, axes_pointer_val] = pointer2d(fig_hndl,axes_hndl)
%
%pointer2d(fig_hndl,axes_hndl)
%
%	Returns the coordinates of the pointer (in pixels)
%	in the desired figure (fig_hndl) and the coordinates
%       in the desired axis (axes coordinates)
%
% Example:
%  figure(1),
%  hold on,
%  for i = 1:1000,
%     [figp,axp]=pointer2d;
%     plot(axp(1),axp(2),'.','EraseMode','none');
%     drawnow;
%  end;
%  hold off

% Rick Hindman - 4/18/01

if (nargin == 0), fig_hndl = gcf; axes_hndl = gca; end;
if (nargin == 1), axes_hndl = get(fig_hndl,'CurrentAxes'); end;

set(fig_hndl,'Units','pixels');

pointer_pos = get(0,'PointerLocation');	%pixels {0,0} lower left
fig_pos = get(fig_hndl,'Position');	%pixels {l,b,w,h}

fig_pointer_pos = pointer_pos - fig_pos([1,2]);
set(fig_hndl,'CurrentPoint',fig_pointer_pos);

if (isempty(axes_hndl)),
	axes_pointer_val = [];
elseif (nargout == 2),
	axes_pointer_line = get(axes_hndl,'CurrentPoint');
	axes_pointer_val = sum(axes_pointer_line)/2;
end;
二 操作
- 将magnify.m放置到主函数所在文件夹。
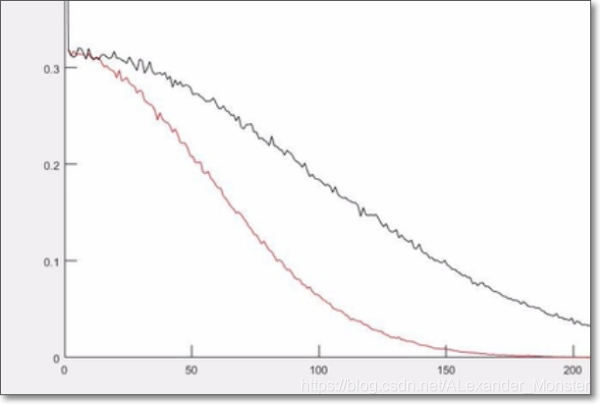
- 绘制你的轨迹图像
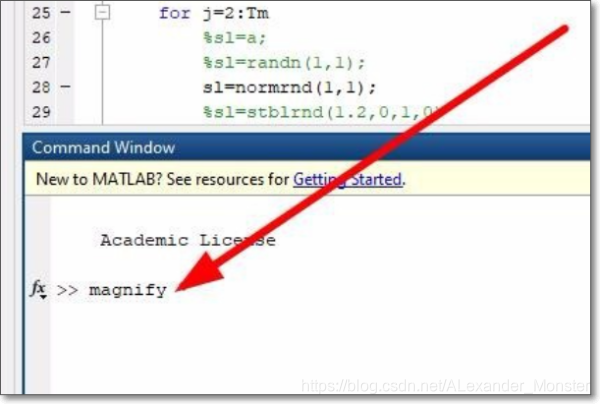
- 紧接着在matlab工作区输入 magnify 然后回车键。
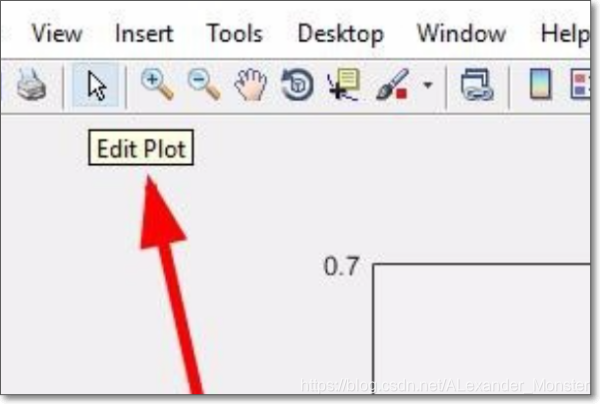
- 按住ctrl+鼠标左键,然后移动鼠标选择对应的放大区域。图片不能是编辑模式度!

- ctrl+鼠标按住之后,ctrl按键可以松开了,但是鼠标左键别松开。问当你松开的时候,系统就自动给你选择好放大的图片了。可以按
<和>调节图片大小。

- 重点来了。有些时候虽然选择了放大比例,但是怎么细致的调节那。可以通过放大和移动来解决这个问题。首先将图片调整为编辑模式。
- 然后鼠标左键选中放大的图片将其移回动到合适的位置。
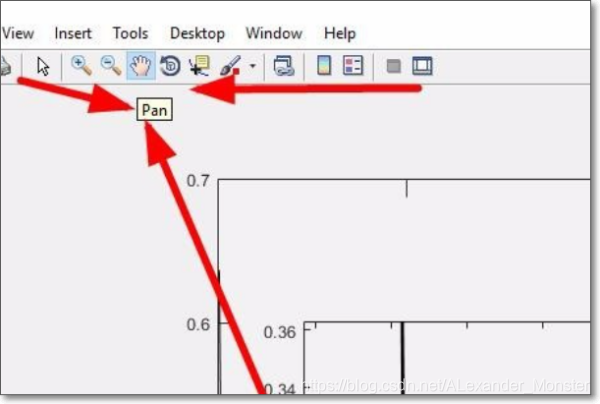
- 然后选择pan按钮,将放大的图片调整到最佳位置即可。

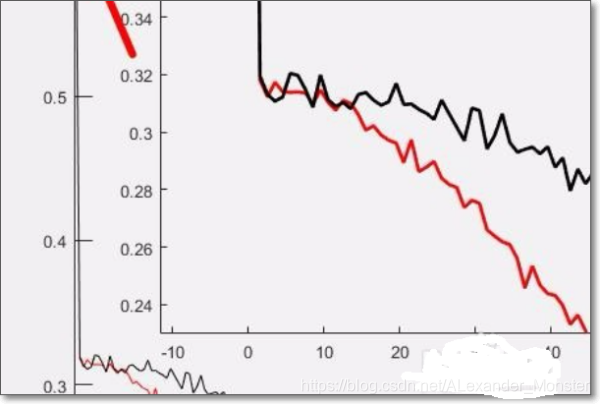
- 完成效果图。
参考资料
[1] xzw1781862471. 怎么将matlab得到的图局部放大呀. 百度问答. 2019. https://zhidao.baidu.com/question/554865980.html