如果需要在一副图中绘制曲线的局部放大效果图,达到类似如下效果:

1.首先创建在一个figure里创建两个坐标轴axes
figure1 = figure(1);
% 创建整体坐标轴axes1
axes1 = axes('Parent',figure1);
hold(axes1,'on');
% 创建局部坐标轴axes2
axes2 = axes('Parent',figure1,...
    'Position',[0.2 0.2 0.3 0.3]);
hold(axes2,'on');
2.在两个坐标轴中同时绘制曲线
semilogx(F(100:1:4000),TL(100:1:4000),'Parent',axes1,'linewidth',1.5);
hold on;
semilogx(F(100:1:4000),TL(100:1:4000),'Parent',axes2,'linewidth',1.5);
hold on;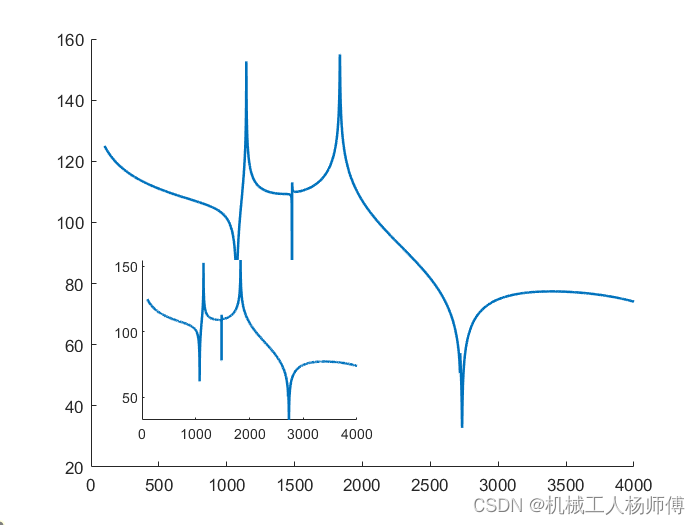
3.给整体坐标轴及局部坐标轴限定xy轴范围,以实现局部坐标轴放大的功能
xlim(axes1,[100,4000]);
xlim(axes2,[1390.70631265666 1569.05484343273]);
ylim(axes2,[95.5623249136124 121.431418092015]);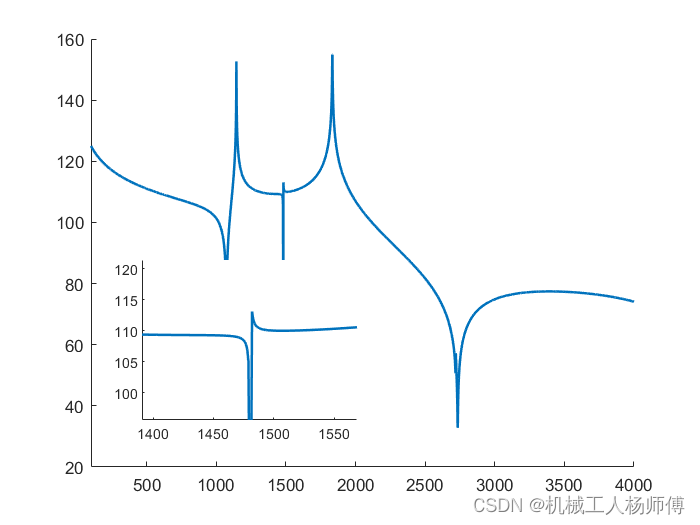
4 .接下来进行自己需要的修改即可:如坐标轴标签设置、legend设置、坐标轴对数显示等等;这里要注意的是,需要明确是对哪个axes1、axes2哪一个坐标轴进行设置。
xlabel(axes1,'f/Hz');
ylabel(axes1,'STL/dB');
box(axes1,'on');
box(axes2,'on');
% 设置其余坐标区属性
set(axes1,'XMinorTick','on','XScale','log');
% 创建 legend
legend1 = legend(axes1,'show');
set(legend1,...
    'Position',[0.164166665236155 0.768412695687915 0.15107143000194 0.12619047891526]);
legend(axes1,{'φ=0°','φ=30°','φ=60°'});
% 创建 arrow
annotation(figure2,'arrow',[0.518571428571429 0.655714285714286],...
    [0.405666666666667 0.54],'Color',[0.0745098039215686 0.623529411764706 1]);
% 创建 ellipse
annotation(figure2,'ellipse',...
    [0.653857142857143 0.519047619047619 0.0832857142857142 0.131428571428572],...
    'Color',[0.0745098039215686 0.623529411764706 1]);