测试 Pin
Pin是一个动态的二进制插桩工具。动态意味着它的插桩在运行时执行,而不需要程序的源码
Instruction:一条汇编指令;
Basic blocks:以条件跳转结尾的指令序列;
Trace:以无条件跳转结尾的基本块序列。
运行一个demo,在这个例子insmixde 工具
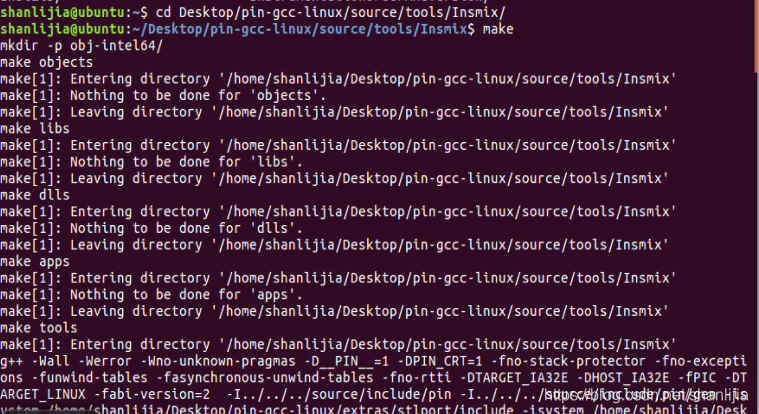
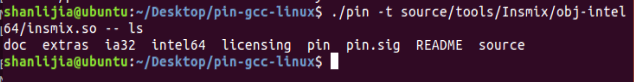
成功的话会在 source/tools/Insmix/obj-intel64/生成insmix.so文件
然后在pin的根目录执行
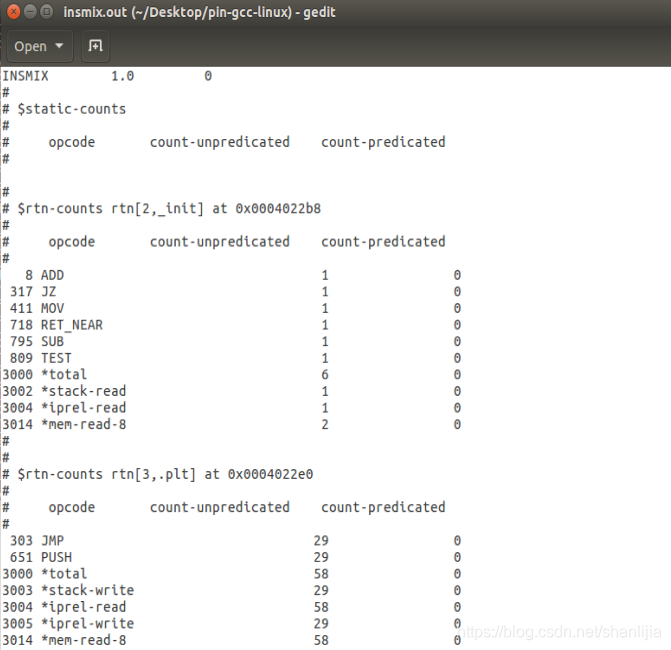
结果文件输出在 pin 根目录下,即 insmix.out。
示例 2:统计 instruction 数量(instruction instrumentation)
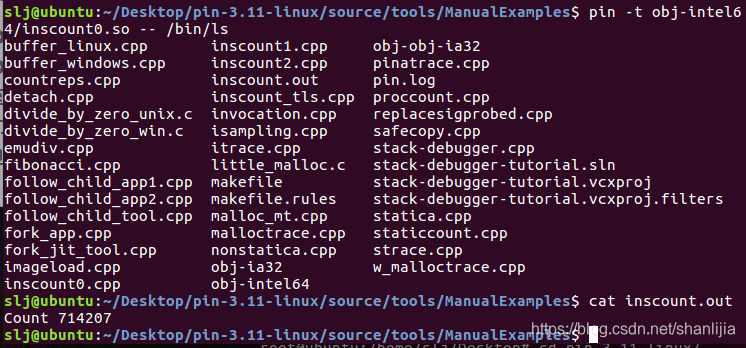
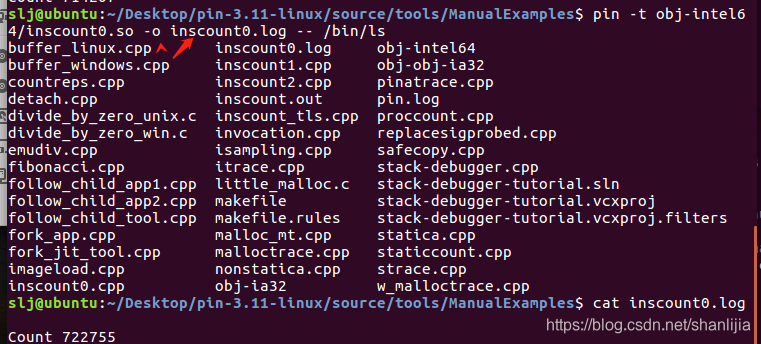
可以通过添加 option 将分析结果输出到指定文件
pin -t obj-intel64/inscount0.so -o inscount0.log – /bin/ls
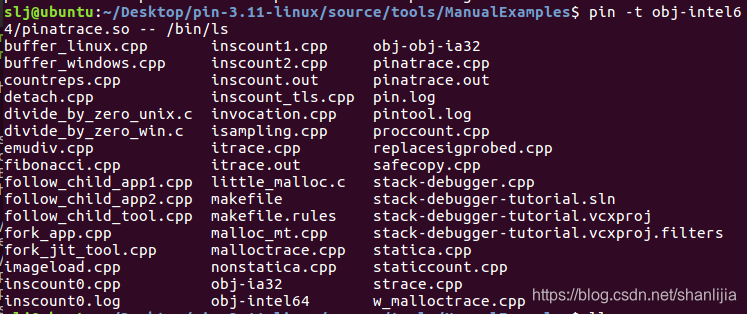
示例 3:内存引用追踪(Memory Reference Trace)
有时只希望 instrument 某一类 instructions, 比如 内存操作(读和写)。为此,可以利用 Pin 提供的,用来 classify 和 examine 指令的API。(对所有指令集的基本 API, 和对某个指令集的特殊 API)
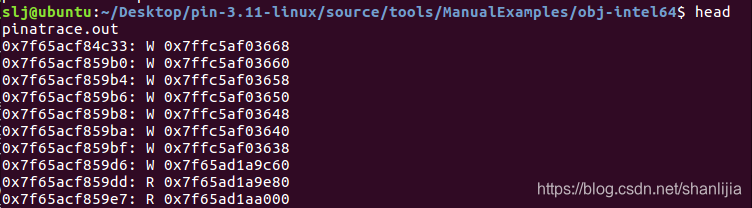
本示例通过 examining 指令来选择性的 instrument instruction。Tool对程序引用的内存地址进行了追踪并输出。同时,这里调用 INS_InsertPredicatedCall 而不是 INS_InsertCall 避免在 the predicate 是 false 的情况下,产生对 predicated instructions 的引用。
源代码:
/*
 *  This file contains an ISA-portable PIN tool for tracing memory accesses.
 */
 #include <stdio.h>
 #include "pin.H"
FILE * trace;// Print a memory read record打印内存读取记录
VOID RecordMemRead(VOID * ip, VOID * addr){

      //打印内存读记录
    fprintf(trace,"%p: R %p\n", ip, addr);}// Print a memory write record
VOID RecordMemWrite(VOID * ip, VOID * addr){


    fprintf(trace,"%p: W %p\n", ip, addr);}// Is called for every instruction and instruments reads and writes //每条指令和插桩读和写
VOID Instruction(INS ins, VOID *v){


    // Instruments memory accesses using a predicated call, i.e.
    // the instrumentation is called iff the instruction will actually be executed.
    //
    // On the IA-32 and Intel(R) 64 architectures conditional moves and REP
    // prefixed instructions appear as predicated instructions in Pin.
    UINT32 memOperands = INS_MemoryOperandCount(ins);

    // Iterate over each memory operand of the instruction.
    for (UINT32 memOp = 0; memOp < memOperands; memOp++)
    {


        if (INS_MemoryOperandIsRead(ins, memOp))
        {


            //只对 MemOp 做 instrument 并加入 analysis 函数 RecordMemWrite
            INS_InsertPredicatedCall(
                ins, IPOINT_BEFORE, (AFUNPTR)RecordMemRead,
                IARG_INST_PTR,
                IARG_MEMORYOP_EA, memOp,
                IARG_END);
        }
        // Note that in some architectures a single memory operand can be
        // both read and written (for instance incl (%eax) on IA-32)
        // In that case we instrument it once for read and once for write.
        if (INS_MemoryOperandIsWritten(ins, memOp))
        {


            INS_InsertPredicatedCall(
                ins, IPOINT_BEFORE, (AFUNPTR)RecordMemWrite,
                IARG_INST_PTR,
                IARG_MEMORYOP_EA, memOp,
                IARG_END);
        }
    }}

VOID Fini(INT32 code, VOID *v){


    fprintf(trace, "#eof\n");
    fclose(trace);}/* ===================================================================== *//* Print Help Message                                                    *//* ===================================================================== */

INT32 Usage(){


    PIN_ERROR( "This Pintool prints a trace of memory addresses\n"
              + KNOB_BASE::StringKnobSummary() + "\n");
    return -1;}/* ===================================================================== *//* Main                                                                  *//* ===================================================================== */int main(int argc, char *argv[]){


    if (PIN_Init(argc, argv)) return Usage();

    trace = fopen("pinatrace.out", "w");

    INS_AddInstrumentFunction(Instruction, 0); //每个 instruction 都会调用
    PIN_AddFiniFunction(Fini, 0);

    // Never returns
    PIN_StartProgram();

    return 0;}