一、简介
Prometheus是一套开源的监控&报警&时间序列数据库的组合.基本原理是通过HTTP协议周期性抓取被监控组件的状态.
Prometheus 中的四种数据类型
(1)Counter:用于累计值,例如记录请求次数、次数完成数、错误发生次数。一直增加不会减少,重启进程后会被重置
(2)Gauge:常规数值,如温度变化、内存、CPU使用变化。重启进程后会被重置
(3)Histogram:直方图(柱状图),常用于跟踪时间发生的规模,例如:请求耗时、响应大小。可以对记录的内容进行分组,提供 count 和 sum 全部值的功能
(4)Summary:与Histogram类似,用于跟踪事件发生的规模,例如:请求耗时、响应大小。同样提供 count 和 sun 全部值的功能。它提供一个quantiles的功能,可以按百分比划分跟踪的结果。例如:quanties 取值 0.95,表示取采样值里面的 95% 数据。
二、安装部署
1、下载安装 go
tar -C /usr/local -xvf go1.15.6.linux-amd64.tar.gz
配置环境变量:
vim /etc/profile
export PATH=$PATH:/usr/lcoal/go/bin
source /etc/profile
go version
2、下载安装 Prometheus
https://prometheus.io/;下载后解压皆可,无需编译
tar -C /usr/local -xvf prometheus-2.24.0.linux-amd64.tar.gz
ln -sv /usr/local/prometheus-2.24.0.linux-amd64/ /usr/local/Prometheus
默认配置文件在 /usr/local/Prometheus/peometheus.yml
启动普罗米修斯:
nohup /usr/local/Prometheus/prometheus --config.file=/usr/local/Prometheus/prometheus.yml &
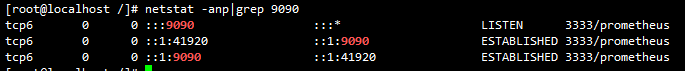
查看9090端口:
netstat -anp|grep 9090
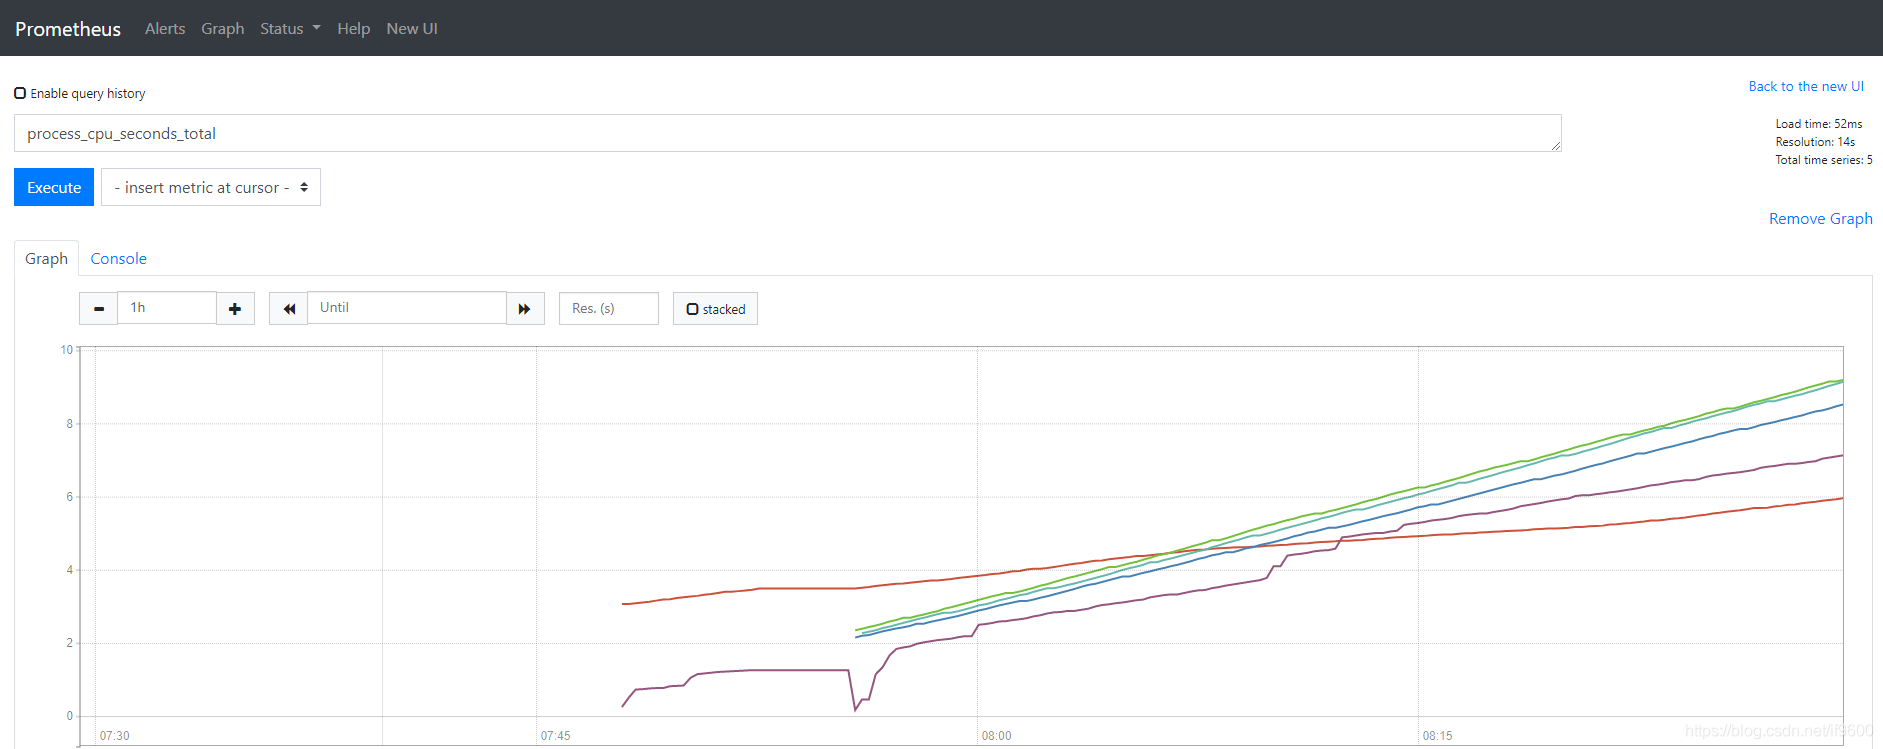
浏览器打开IP:9090 ->Status->Tragets;即可打开普罗米修斯自带的监控页面
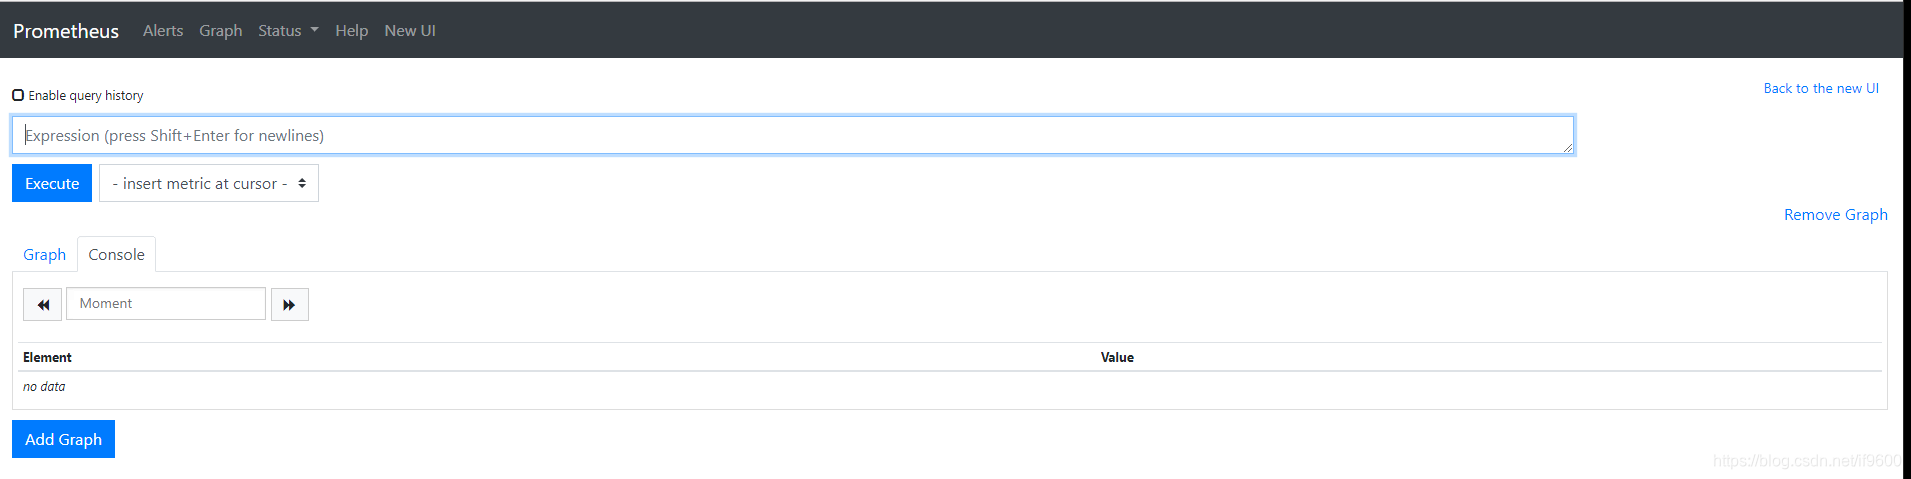
可以通过关键字查询监控项
3、下载安装 grafana(grafana 是一个开箱即用的可视化工具,具有功能齐全的度量仪表盘和图形编辑器,有灵活丰富的图形化选项,可以混合多种风格)
rpm -ivh --nodeps grafana-5.4.2-1.x86_64.rpm
启动:
sudo /bin/systemctl daemon-reload
sudo /bin/systemctl enable grafana-server.service
sudo /bin/systemctl start grafana-server.service
浏览器访问IP:3000 即可打开 grafana 页面,默认用户名密码是 admin,首次登录需要修改默认密码
4、添加监控数据源
(1)点击主界面的 “Add data source”
(2)选择Prometheus
(3)Dashboards 界面选择 “Prometheus 2.0 Stats”
(4)Settings 页面填写普罗米修斯地址并保存
(5)切换到刚才添加的 “Prometheus 2.0 Stats”即可看到整个监控页面
5、监控linux机器
(1)被监控的机器安装 node_exporter
https://github.com/prometheus/node_exporter/releases/download/v0.17.0/node_exporter-0.17.0.linux-amd64.tar.gz
tar -C /use/local xvf node_exporter-0.17.0.linux-amd64.tar.gz
(2)启动 node_exporter
nohup /usr/local/node_exporter-0.17.0.linux-amd64/node_exporter &
查看9100端口:
netstat -anp|grep 9100
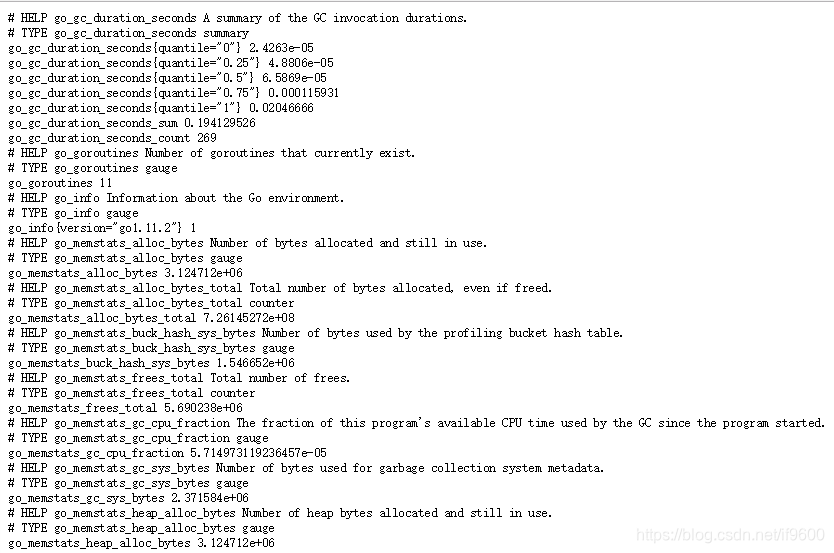
通过浏览器访问 IP:9100/metrics 可以查看 node_exporter 被收集的监控信息
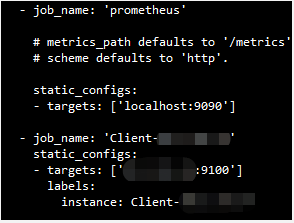
(3)配置文件添加监控项
vim /usr/local/Prometheus/prometheus.yml
添加完成后重启
默认使用的是 static_configs 静态配置方式,虽然可以正确配置,但是每次配置都需要重启 Prometheus 服务,当需要多次添加多个监控项是,频繁重启服就会造成监控的多次中断。Prometheus 提供了多种服务发现方式,https://prometheus.io/docs/prometheus/latest/configuration/configuration/#scrape_config;
这里可以采用 file_sd_configs 方式,将 targets 以 json 或者 yaml 方式写入特定文件中,只要文件发生变化,Prometheus 就会自动加载。
新建一个 node.json 文件,将 prometheus.yml 中 job_name:‘node-exporter’ 下的信息以 json 方式配置到该文件中,然后修改配置文件中加载方式为 file_sd_config
$ midir -p /root/prometheus/groups/nodegroups && cd /root/prometheus/groups/nodegroups
$ vim node.json
[
    {
        "targets": [
            "xxx.xxx.xxx.xxx:9100"
        ],
        "labels": {
            "instance": "xxx",
            "service": "node-service"
        }
    }
]
...
    - job_name: 'node-exporter'
     file_sd_configs:
       - files: ['/root/prometheus/groups/nodegroups/node.json']
三、FAQs
运行一段时间后如果发现无法查看监控数据了,报错“out of bounds”,可能是服务器时间跳变了;服务器之间最好时间同步.