简介
这是“面向初学者的 MQL4 语言”系列的第三篇文章。在前两篇文章中, 我们学习了 MQL4 的基础知识,它们是进一步开发的基石。现在我们将学习使用内置 函数和用于技术指标的函数。后者对于以后开发你自己的 Expert Advisor 和指标至 关重要。另外,我们将通过一个简答的例子,解释如何追踪进入市场的交易信号, 以及如何正确使用指标。在文章的末尾,你将学到一些关于语言本身的新鲜有趣的内容。
数学函数
让我们从最简单但仍在使用且有帮助的数学函数开始。
MathAbs
函数原型:
double MathAbs(double value)
这是非常简单的函数,返回绝对值(数字模块)。它的意思是,如果你使用了负数,则会得到一个正数结果。使用示例:
int a=-10;
double b=-20.0;
double c=7.0;

a=MathAbs(a); // now a is equal to 10
b=MathAbs(b); // now b is equal to 20.0
c=MathAbs(c); // the value of c will not change, for it was positive
MathCeil、MathFloor 和 MathRound
函数的原型:
double MathCeil(double x)
double MathFloor(double x)
double MathRound(double value)
这三个函数非常类似:它们均将数字圆整为整数。 但每个都有其独特性:MathCeil 的圆整方式为: 即使我们有一个整数的千分之一(例如,1.001),它依然被视为一个整数。 即数字被向上圆整为更大的值。例如:
double a;
a=MathCeil(1.001);  // a=2.0, even one thousandth is rounded off to a whole number
a=MathCeil(1.999);  // a=2.0
a=MathCeil(-1.001); // a=-1.0, it is correct, because -1.0 is more than -1.001
a=MathCeil(-1.999); // a=-1.0, it is correct, -1.0 is more than -1.999
MathFloor 跟 MathCeil 类似,但正好相反。即如果需要向下圆整一个正数,则会损失小数部分:
double a;
a=MathFloor(1.999); // a=1.0, no matter how large the fractional part is, it will be taken away
a=MathFloor(1.001); // a=1.0
a=MathFloor(-1.001); // a=-2.0, correct, because -2.0 is less than -1.001
a=MathFloor(-1.999); // a=-2.0, correct, -2.0 is less than -1.999
我们对MathRound 圆整数字的方式较为熟悉。即如果小数部分较大( 0.5 或以上),则圆整为 1。如果小数部分较小(小于 0.5),则圆整为 0,即直接忽略。示例:
double a;
a=MathRound(1.1);   // a=1.0, the fractional part is too small (0.1)
a=MathRound(1.57);  // a=2.0, the fractional part is enough to be rounded off to 1
a=MathRound(-3.1);  // a=-3.0 not enough
a=MathRound(-6.99); // a=-7.0 enough
MathMin
函数的原型:
double MathMax(double value1, double value2)
double MathMin(double value1, double value2)
这两个函数非常类似。它们接受 2 个参数,相应的返回最大值和最小值。示例:
double a;
a=MathMax(50.0,1.0);  // a=50.0
a=MathMin(10.0,12.0); // a=10.0
函数原型:
double MathPow(double base, double exponent)
该函数允许取底数的幂次方。示例:
double a;
a=MathPow(5.0,2.0);  // a=25.0, 5 to the power 2
a=MathPow(2.0,8.0);  // a=256.0, 2 to the power 8
a=MathPow(25.0,0.5); // a=5.0, you know, a number to the power 0.5 is its square root
函数原型:
double MathSqrt(double x)
使用该函数求平方根。但不要尝试求负数的平方根。这样的话,会返回零。示例:
double a;
a=MathSqrt(9.0);    // a=3.0
a=MathSqrt(25.0);   // a=5.0
a=MathSqrt(-256.0); // a=0.0, I explained
函数原型:
double MathLog(double x)
还有人记得什么是对数吗?以 b 为底 a 的对数等于以 b 为底获得 a 所需要的幂次方。 广泛使用的对数是以 e 为底(欧拉数)的自然对数(lna)和以 10 为底的常用(布氏)对数(lg a)。 关于对数的更多信息可见于:http://en.wikipedia.org/wiki/Logarithm, 因此,MathLog 用于求数字 x 的自然对数。不要对负数或零求自然对数。这种情况下,会得到 -1。使用函数的示例:
double a;
a=MathLog(10.0);  // a=2.30258509
a=MathLog(0.0);   // a=-1.0, incorrect
a=MathLog(-10.0); // a=-1.0, incorrect
函数原型:
double MathExp(double d)
该函数返回数字 e,取 d次幂。很多人一定已经忘记了这个数字。 e 是数字常数,自然对数的底,无理数和超越数。e = 2,718281828459045…有时候 e 被称为欧拉数或纳皮尔数。 在微分和积分学中起着重要作用。关于欧拉数的更多信息可见于:http://en.wikipedia.org/wiki/Eulerian_number 如果指定一个非常大的度数,则会发生溢出,从而返回零。多大才会导致错误呢?为了找出答案,我们来做一个小实验:
double exponent=1.0; // here the degree value will be stored
double result=1.0;   // result, returned by the function
int i=0;             // number of cycle iterations

while(result!=0.0)   // while the result is not equal to zero (while there is no overflowing)
{
   result=MathExp(exponent); // remember the result
   exponent*=10.0;           // increase the degree
   i++;                      // the next iteration is over
}
MessageBox("i="+i); // result of the experiment
发生以下情形:每次尝试调用 MathExp 函数,以及每次循环时度数增长了 10 倍,直到最后出现溢出,返回零。我得到以下结果:i=310。这意味着你可以使用 1*10 度数对 309 的乘方运算(想一下长达 309 位的数字!!)。所以,我认为不需要担心溢出。
MathMod
函数原型:
double MathMod(double value,double value2)
该函数用来找到除法的余数。例如,5 除以 2 得 2 余 1。第一个参数value - 被除数,value2 - 除数。返回余数。示例:
double a;

a=MathExp(5,2); // a=1.0
a=MathExp(10,3); // a=1.0, correct
a=MathExp(50,10); // a=0.0, divided without residue
函数的原型:
int MathRand() void MathSrand(int seed)
MathRand 返回介于 0 和 32767 范围内的伪随机整数。这里你可能会有些疑惑:“伪”是什么意思? 这个范围很奇怪,如果我需要 5 到 10 的范围怎么办?为什么非得是 32767?答案是:“伪” 意味着数字并非完全随机,而是取决于某些事情。假设,你已经编写了一个脚本,返回了 5 个伪随机数字。例如:
int a=0;

while(a<5)
{
   MessageBox(“random=”+MathRand());
   a++;
}
这些数字确实是随机的,但如果你再次运行脚本,序列始终是相同的。原因在于,存在函数 MathRand 开始排斥的数字。 让我们称该数字为起始数字。为了改变它,使用另一个函数 - MathSrand。 该函数接受单个参数——起始数字,它决定所有的伪随机数。假设起始数字为一粒果实, 则随机数字就是从中生长的大树。默认的起始数字为 1。为了获得真正的随机序列,我们先要给起始数字分配唯一的值。 如何去做呢?还有一个函数 - TimeLocal,它没有参数,返回自 1970 年 1 月 1 日 00:00 起的秒数。 该函数非常适合,因为在大多数情况下我们将获得唯一的数字。是不是开始糊涂了?它看起来如下所示:
int a=0;
MathSrand(TimeLocal()); // assign a unique value to the beginning number

while(a<5)
{
   MessageBox(“random=”+MathRand());
   a++;
}
现在每次我们都会得到一个新的序列。让我们继续。从 0 到 32767。为什么是 32767? 原因在于:int 能够接受的最大值是 2 的 16 次方(因为在不考虑符号时,int 变量值在计算机内存中占了 16 位),即 32768,因为我们从零计数,所以需要减去 1。这样就得到 32767 。为了得到任意的必要范围,使用运算符 % - 除法中的余数。例如,如果需要得到 0 到 5 范围的随机数字:
int a=0;
MathSrand(TimeLocal());
while(a<5)
{
   MessageBox(“random=”+MathRand()%6);
   a++;
}
请注意,我们写入 MathRand()%6 而非 MathRand()%5 - 我们的范围从零开始,需要加 1。现在假设我们需要得到 5 到 10 范围内的随机数字:
MessageBox(“random=”+MathRand()%6+5); // just add the necessary shift
当需要包括负数的范围时,例如 -5 到 5,方法一样。
MessageBox(“random=”+MathRand()%11-5);
如果只需要负数,将结果乘以 -1。例如,我们需要 -10 到 -20 的范围:
MessageBox(“random=”+(MathRand()%11+10)*(-1));
如果需要得到非整数,例如在 0.0 到 1.0 范围内,且精确到千分位,使用以下代码:
MessageBox(“random=”+MathRand()%1001/1000.0);
我们先创建一个 0 到 1000 范围的随机数字,然后除以 1000.0。注意,必须除以 1000.0(带一个浮点),而不是 1000(整数)。 否则会得到零,因为会被圆整。
三角函数和反三角函数
三角函数是基于角度的数学函数。它们在分析周期性过程时非常重要。与之密切相关的是反三角函数。 更多信息可见于:http://en.wikipedia.org/wiki/Trigonometric_function http://en.wikipedia.org/wiki/ArcSin在 MQL4 中,所有这些函数接受以弧度而非度数表示的参数。即,如果要求 20 度的正弦,必须先将 20 度转换为弧度。例如:
MathSin(20.0*3.14159/180.0);
即 1 度 = pi / 180。如果你经常使用三角函数,则在程序开始时声明并使用该常数较为方便。
#define PI 3.1415926535897
MathSin、MathCos、MathTan、MathArcsin、MathArccos 和 MathArctan
函数的原型:
double MathSin(double value) double MathCos(double value) double MathTan(double x) double MathArcsin(double x) double MathArccos(double x) double MathArctan(double x)
让我们对部分函数的特性深入探讨一下。MathTan 接受 -263 到 263 范围内的值,如果超过限值,数字将变为不确定。MathArcsin 和 MathArccos 接受 -1 到 1 范围内的值,否则会得到 0 和 EA 日志内的相应信息。MathArctan 如果接受 0 则返回 0。
显示信息的新函数
目前你仅知道一个显示信息的函数 - MessageBox。现在你将学习另外三个非常相似但各具特性的函数。
Alert
函数原型:
void Alert(...)
显示包含你的信号(信息)的对话框。调用该函数时,会听到特殊的信号,可以在终端设置中更改或禁用:Service -> Settings -> tab Events.窗口外观如下:
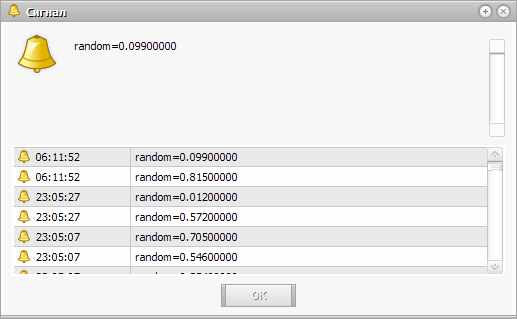
可以更改窗口的尺寸,以便于查看大量信息。另外,可以始终查看函数的最新调用,因为他们不会被删除。还可以进行连续多次调用,将会得到具有活动的最新信号的窗口,不需要每次都点击“确定”。可以使用类似 MessageBox 的函数:
Alert(“signal type:”+signalType); Alert(“random=”+MathRand()%1001);
尽管目的不同。你应该直接列举输入的参数,用逗号分隔。即类似于上例,但使用 “,”代替“+”。我建议使用第二种。
Alert(“signal type:”,signalType); Alert(“random=”,MathRand()%1001);
Comment
函数原型:
void Comment(...)
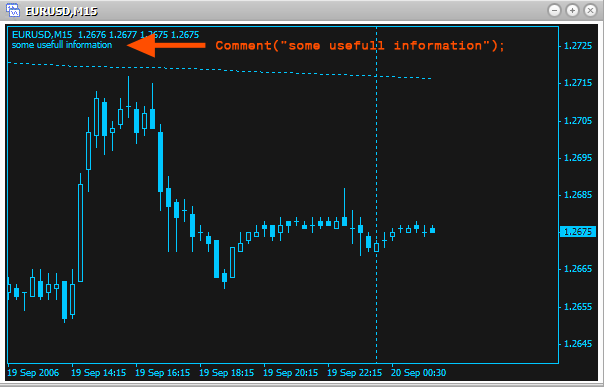
相似的函数,用法一致,在图表左上角显示信息。这里你不需要点击任何区域即可执行代码。使用该函数以显示当前状态等。示例:
Comment(“some usefull information”);
函数原型:
void Print( ...)
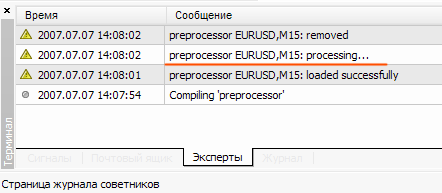
又一个类似的函数,在 Expert Advisor 的日志中显示信息:
Print(“processing...”);
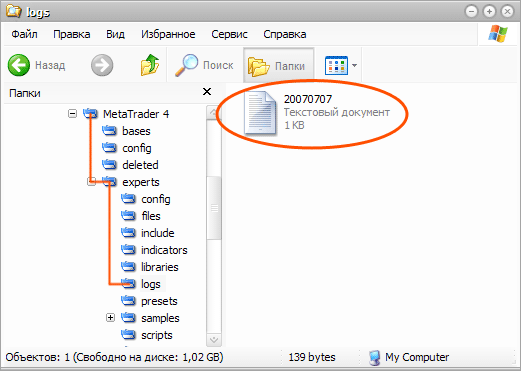
另外,日志在电脑上 MetaTrader 4\experts\logs 文件夹内的相应文件(文件名称跟日期对应)中保存所有的信息:
还应该对三个函数进行注释。无法显示数组,只能像参数一样指示。它们应该按元素逐个进行显示,例如:
for(int a=0;a<100;a++) Alert("Close[",a,"]=",Close[a]);
每个函数最多可以显示 64 个参数。每次调用 Alert 函数也会写入 Expert Advisor 日志。double 类型将显示精确到小数点后 4 位数字。
技术指标
几乎所有的 Expert Advisor 都使用技术指标。如果看一下安装文件(MACD Sample)中包含的简单 EA,可以看到它使用了技术指标。现在你将学习如何获取所有可用技术指标的值。每一个技术指标都有一个对应的函数,可以计算任何可用证券和时间范围上的数值。不必担心指标是否已在图表上打开。这无所谓。
现在让我们查看技术指标的函数的参数细节。实际上其中大多数是重复的。例如,我们要讲解的所有函数都有相似的 2 个第一参数和1 个最后参数以计算技术指标的值。
- 交易品种 – 定义应该用于计算技术指标值的金融证券(货币对)的第一个参数。即技术指标应该用于什么图表。要在当前图表上使用指标,使用常量 NULL(或 0)。此处的当前图表指的是将运行脚本(Expert Advisor,指标)的图表。如果需要另一个证券,可以使用其名称作为字符串(“EURUSD”、“GBPUSD”等等)。
- 时间范围 – 第二个参数,定义应使用指标的时间范围。如果需要当前图表上使用的时间范围,使用 0(零)。如果需要其他时间范围,使用预定义的常量之一:
- PERIOD_M1 - 1 分钟
- PERIOD_M5 - 5 分钟
- PERIOD_M15 - 15 分钟
- PERIOD_M30 - 30 分钟
- PERIOD_H1 - 1 小时
- PERIOD_H4 - 4 小时
- PERIOD_D1 - 1 天
- PERIOD_W1 - 1 周
- PERIOD_MN1 - 1 月
- 偏移 – 定义应该使用指标的柱的最后一个参数。记住第一篇文章:要找到最后一根柱的收盘价,我们使用了从零开始的指数。即 Close [0] - 最后一根柱的收盘价,Close[1] - 倒数第二根柱,以此类推。该参数跟数组中的索引工作方式类似。要找到最后一根柱上的指标数值,偏移必须等于 0,倒数第二个柱为 1,以此类推。
技术指标通常用于计算多个柱上的平均值。即它们取多个柱上的不同价格(开盘价、收盘价等),使用确定的方法找到平均值。也经常使用偏移。在参数当中,可以发现以下:
- applied_price – 定义应该使用什么价格类型以获取平均值。对于选择使用的价格,有以下预定义的常量:
- PRICE_CLOSE - 收盘价格
- PRICE_OPEN - 开盘价格
- PRICE_HIGH - 最高价格
- PRICE_LOW - 最低价格
- PRICE_MEDIAN - 平均价格,(最高价+最低价)/2
- PRICE_TYPICAL - 典型价格,(最高价+最低价+收盘价)/3
- PRICE_WEIGHTED - 加权收盘价格,(最高价+最低价+收盘价+收盘价)/4
- ma_method – 定义一种用于接收平均值的方法。对于选择一种方法,有以下预定义的常量:
- MODE_SMA - 简单移动平均线
- MODE_EMA - 指数移动平均线
- MODE_SMMA - 平滑移动平均线
- MODE_LWMA - 线性加权移动平均线
- period – 定义将使用多少柱获取平均值。
- ma_shift – 柱内中线的偏移。如果偏移为正,则线右移。相反,如果偏移为负,则线左移。
以上描述的参数会经常出现。所以,当你看到这种参数,应该了解该函数使用平均值进行数值计算。为了了解数值究竟如何计算以及平均值到底扮演了什么角色,使用每个函数的简短描述后面的链接。还有一个重要的注意事项:所有这些指标(函数)可以分为两类:
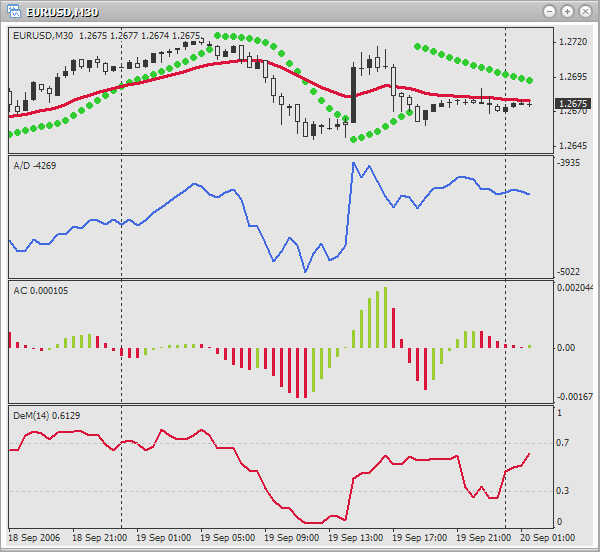
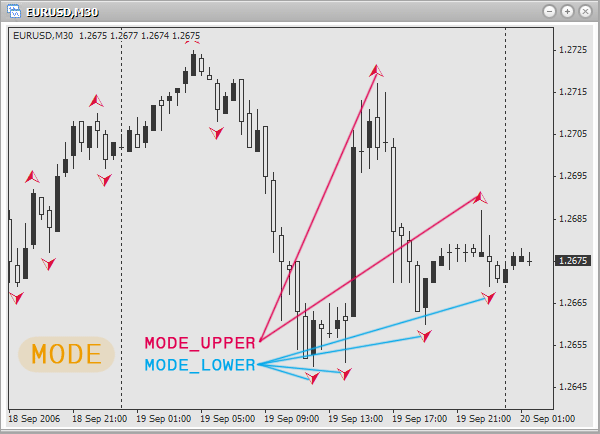
- 简单 – 一个指标只有一个值。例如:加速/减速(AC)指标、累积/派发(A/D)指标、DeMarker(DeM)指标等等,即指标只有一条线/一个柱形图,其数值在调用适当的函数时返回。以下是一个图表上使用多个简单指标的示例:
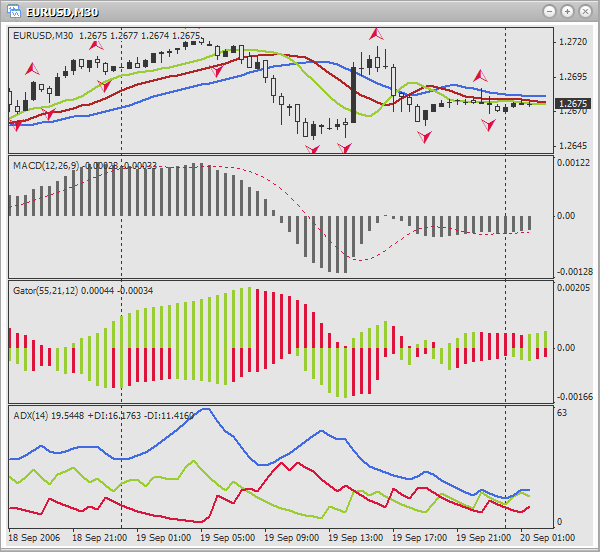
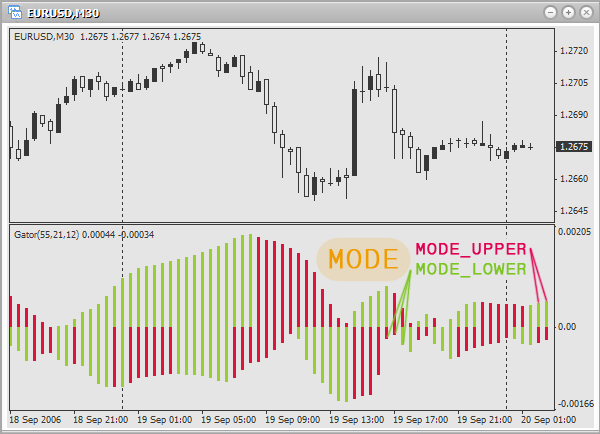
- 复杂 – 一个指标有多个值(线)。例如:鳄鱼指标、平均方向性运动指标(ADX)、布林带指标(BB)、指数平滑移动平均线指标(MACD)等等。此时需要指明指标应该返回什么值(线)。为此,在所有复杂指标的函数中均使用 mode 参数。使用某些常量需要指明应该返回什么。以下是一个图表上使用多个复杂指标的示例:
每个函数描述配以描述性图片、使用示例(使用不同的颜色以更好的查看哪部分对应哪部分)和带有指标描述的链接(如何在交易中使用、指标的含义)。你应该熟悉指标并在实践中使用。我建议阅读本文中对函数的描述,以理解如何使用并查看示例。但为了日后记住每个参数的分配,使用 MetaEditor 中的“帮助”。使用热键 Ctrl+T 打开工具箱 窗口,前往帮助选项卡。在这里,你会发现对每个参数的描述,以及所有函数的快捷列表,可以轻松找到所需要的函数。“帮助”中的语言可以使用查看 ->语言菜单更改。之后重启 MetaEditor。
加速/减速(AC)指标
加速/减速(AC)指标用于更改价格变动的速度(加速、减速)。http://ta.mql4.com/indicators/bills/acceleration_deceleration
函数原型:
double iAC(string symbol, int timeframe, int shift)
参数:
- 交易品种 – 定义应该用于技术指标值计算的金融证券(货币对)。如果你需要当前(活动)的证券(图表),则使用 NULL(或 0)。
- 时间范围 – 定义应该使用指标的时间范围(时长)。对当前时期使用 0 或以下常量之一(PERIOD_M1、PERIOD_M5、PERIOD_M15、PERIOD_M30、PERIOD_H1、PERIOD_H4、PERIOD_D1、PERIOD_W1、PERIOD_MN1)。
- shift – 定义应该使用指标的柱。
使用示例:
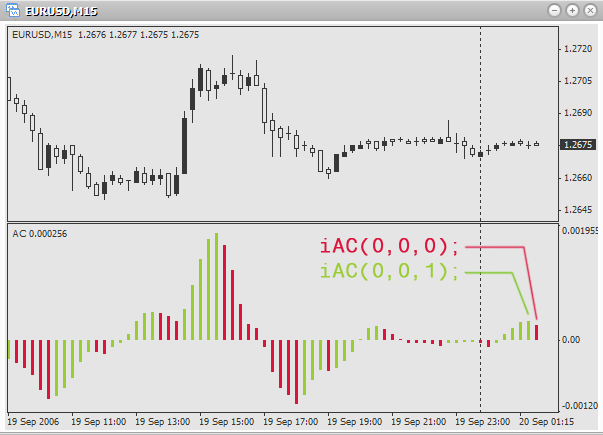
double ac;

ac=iAC(0,0,0);
// acceleration of the last bar on the active chart and timeframe

ac=iAC(0,0,1);
// acceleration of the last but one bar on the active chart and timeframe

ac=iAC("GBPUSD",PERIOD_M30,0);
// acceleration of the last bar on the chart GBPUSD, timeframe - 30 minutes
累积/派发(A/D)指标
累积/派发(A/D)指标通过交易量计算确认价格变动。http://ta.mql4.com/indicators/volumes/accumulation_distribution 函数原型:
double iAD(string symbol, int timeframe, int shift)
参数:
- 交易品种 – 定义应该用于技术指标值计算的金融证券(货币对)。如果你需要当前(活动)的证券(图表),则使用 NULL(或 0)。
- 时间范围 – 定义应该使用指标的时间范围(时长)。对当前时期使用 0 或以下常量之一(PERIOD_M1、PERIOD_M5、PERIOD_M15、PERIOD_M30、PERIOD_H1、PERIOD_H4、PERIOD_D1、PERIOD_W1、PERIOD_MN1)。
- shift – 定义应该使用指标的柱。
使用示例:
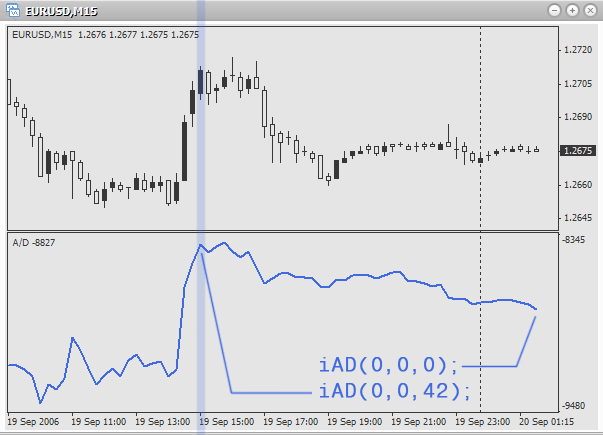
double ad;

ad=iAD(0,0,0);
// accumulation on the last bar on the current chart and period

ad=iAD(0,0,Bars-1);
// accumulation on the first available bar, active chart and period

ad=iAD("GBPUSD",PERIOD_M5,5);
// accumulation on the 6th last bar on GBPUSD, period - 5 minutes
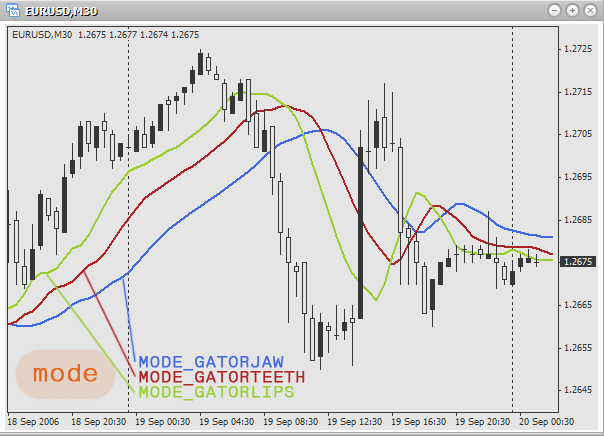
鳄鱼指标
鳄鱼指标是三根移动平均线的组合,使用分形几何和非线性动力学。http://ta.mql4.com/indicators/bills/alligator 函数原型:
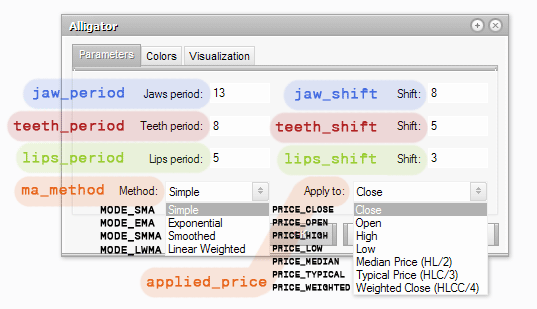
double iAlligator( string symbol, int timeframe, int jaw_period, int jaw_shift, int teeth_period, int teeth_shift, int lips_period, int lips_shift, int ma_method, int applied_price, int mode, int shift)
参数:
- 交易品种 – 定义应该用于技术指标值计算的金融证券(货币对)。如果你需要当前(活动)的证券(图表),则使用 NULL(或 0)。
- 时间范围 – 定义应该使用指标的时间范围(时长)。对当前时期使用 0 或以下常量之一(PERIOD_M1、PERIOD_M5、PERIOD_M15、PERIOD_M30、PERIOD_H1、PERIOD_H4、PERIOD_D1、PERIOD_W1、PERIOD_MN1)。
- jaw_period - 鳄鱼下颚平均周期(蓝线)
- jaw_shift - 蓝线相对偏移量
- teeth_period - 鳄鱼牙齿平均周期(红线)
- teeth_shift - 红线相对偏移量
- lips_period - 鳄鱼嘴唇平均周期(绿线)
- lips_shift - 绿线相对偏移量
- ma_method – 定义一种用于接收平均值的方法。对于选择一种方法,有以下预定义的常量:
- MODE_SMA - 简单移动平均线
- MODE_EMA - 指数移动平均线
- MODE_SMMA - 平滑移动平均线
- MODE_LWMA - 线性加权移动平均线
- applied_price – 定义要使用的价格(要进行平均的价格)对于选择使用的价格,有以下预定义的常量:
- PRICE_CLOSE - 收盘价格
- PRICE_OPEN - 开盘价格
- PRICE_HIGH - 最高价格
- PRICE_LOW - 最低价格
- PRICE_MEDIAN - 平均价格,(最高价+最低价)/2
- PRICE_TYPICAL - 典型价格,(最高价+最低价+收盘价)/3
- PRICE_WEIGHTED - 加权收盘价格,(最高价+最低价+收盘价+收盘价)/4
- mode – 定义要返回的数据(下颚、牙齿或嘴唇)。对于选择使用常量之一:
- MODE_GATORJAW - 鳄鱼的下颚线(蓝色)
- MODE_GATORTEETH - 鳄鱼的牙齿线(红色)
- MODE_GATORLIPS - 鳄鱼的嘴唇线(绿色)
- shift – 定义应该使用指标的柱。
在图表上使用鳄鱼指标时,注意函数参数代表的功能。这种类比将帮助你:
使用模式参数,定义应返回内容:
使用示例:
double jaw;
double teeth;
double lips;

jaw=iAlligator(0,0,13,8,8,5,5,3,MODE_SMA,PRICE_MEDIAN,MODE_GATORJAW,0);
// find the values of "jaws" (blue line) on the current chart and period.
// Here simple moving average is used, price – average. Periods
// of averaging for jaws, teeth and lips – 13, 8 and 8 accordingly. Shift:
// 5, 5 and 3 accordingly. The value is taken for the last bar.

teeth=iAlligator(“EURUSD”,PERIOD_H1,128,96,64,0,0,0,MODE_EMA,PRICE_TYPICAL,MODE_GATORTEETH,1);
// find the values of "teeth" (red line) on an hour chart EURUSD.
// Exponential moving average and typical price are used.
// Periods of averaging: 128, 96 and 64. Shift is not used. The value
// is taken for the last but one bar.

lips=iAlligator(“GBPUSD”,PERIOD_D1,21,18,13,5,3,0,MODE_SMMA,PRICE_WEIGHTED,MODE_GATORLIPS,5);
// find the values of "lips" (green line) on a daily chart GBPUSD.
// Uses smoothed moving average and weighted close price.
// Periods of averaging: 21, 18 and 13. Shift: 5, 3 and 0. The value
// is taken for the 5th last bar.
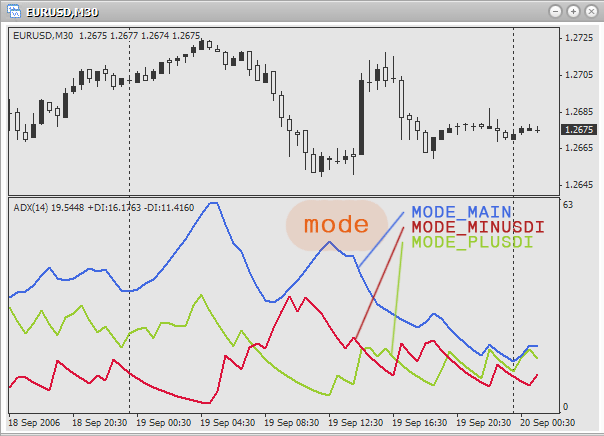
平均方向性运动指标(ADX)
平均方向性运动(ADX)指标用于确定价格趋势的出现。http://ta.mql4.com/indicators/trends/average_directional_movement 函数原型:
double iADX(string symbol,int timeframe,int period,int applied_price,int mode,int shift)
参数:
- 交易品种 – 定义应该用于技术指标值计算的金融证券(货币对)。如果你需要当前(活动)的证券(图表),则使用 NULL(或 0)。
- 时间范围 – 定义应该使用指标的时间范围(时长)。对当前时期使用 0 或以下常量之一(PERIOD_M1、PERIOD_M5、PERIOD_M15、PERIOD_M30、PERIOD_H1、PERIOD_H4、PERIOD_D1、PERIOD_W1、PERIOD_MN1)。
- 周期 – 柱的数量,用于得出平均值。
- 模式 – 选择一条线,其数值将会被接收。使用以下预定义的常量:
- MODE_MAIN - 主线
- MODE_PLUSDI - +DI 线
- MODE_MINUSDI - –DI 线
- shift – 定义应该使用指标的柱。
使用 mode 参数,定义应返回的内容:
使用示例:
double main;    // main line
double plusDi;  // line +DI
double minusDi; // line -DI

main=iADX(0,0,3,PRICE_CLOSE,MODE_MAIN,0);
// find the value of the main line on the active chart and period on the last bar.
// Uses averaging on 3 bars, uses close price.

plusDi=iADX(“USDCAD”,PERIOD_M1,6,PRICE_OPEN,MODE_PLUSDI,1);
// find the value of line +DI on the minute chart USDCAD on the second last bar.
// Uses averaging on 6 bars, uses open price.

minusDi=iADX(“AUDUSD”,PERIOD_H1,10,PRICE_HIGH,MODE_MINUSDI,5);
// find the value of line -DI on the hour chart AUDUSD on the 6th last bar.
// Uses averaging on 10 bars, uses maximal price.
平均真实波动范围指标(ATR)
平均真实波动范围(ATR)指标用于确定市场波动性。http://ta.mql4.com/indicators/oscillators/average_true_range 函数原型:
double iATR(string symbol,int timeframe,int period,int shift)
参数:
- 交易品种 – 定义应该用于技术指标值计算的金融证券(货币对)。如果你需要当前(活动)的证券(图表),则使用 NULL(或 0)。
- 时间范围 – 定义应该使用指标的时间范围(时长)。对当前时期使用 0 或以下常量之一(PERIOD_M1、PERIOD_M5、PERIOD_M15、PERIOD_M30、PERIOD_H1、PERIOD_H4、PERIOD_D1、PERIOD_W1、PERIOD_MN1)。
- 周期 – 柱的数量,用于得出平均值。
- shift – 定义应该使用指标的柱。
使用示例:
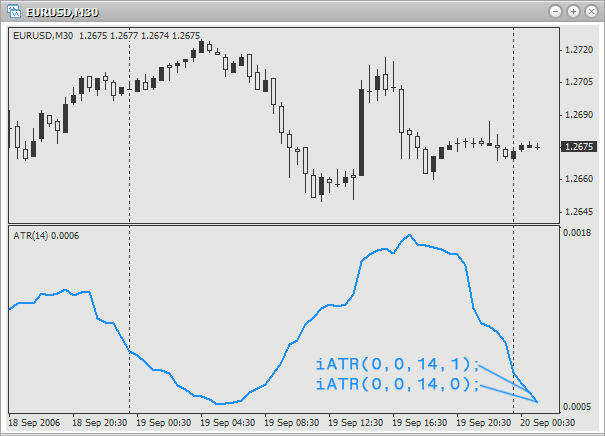
double atr;

atr=iATR(0,0,15,0);
// volatility of the last bar on the active chart and period.
// Uses 15 bars to get the mean value.

atr=iATR(“EURUSD”,PERIOD_M15,5,1);
// volatility of the last but one bar on a 15 minute chart EURUSD.
// Uses 5 bars to get the mean value.

atr=iATR(“USDCAD”,PERIOD_H1,32,0);
// volatility of the last bar on an hour chart USDCAD.
// Uses 32 bars to get the mean value.
比尔·威廉姆的动量震荡指标(AO)
比尔·威廉姆的动量震荡(AO)指标用于确定市场动力。http://ta.mql4.com/indicators/bills/awesome 函数原型:
double iAO( string symbol, int timeframe, int shift)
参数:
- 交易品种 – 定义应该用于技术指标值计算的金融证券(货币对)。如果你需要当前(活动)的证券(图表),则使用 NULL(或 0)。
- 时间范围 – 定义应该使用指标的时间范围(时长)。对当前时期使用 0 或以下常量之一(PERIOD_M1、PERIOD_M5、PERIOD_M15、PERIOD_M30、PERIOD_H1、PERIOD_H4、PERIOD_D1、PERIOD_W1、PERIOD_MN1)。
- shift – 定义应该使用指标的柱。
使用示例:
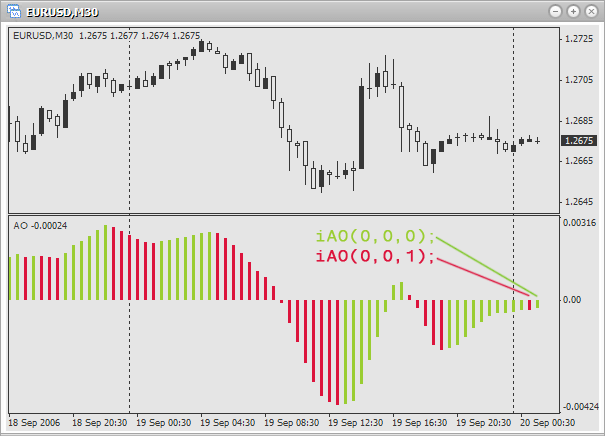
double ao;

ao=iAO(0,0,0);
// moving force of the last bar on the active chart and period

ao=iAO(“EURUSD”,PERIOD_M5,0);
// moving force of the last bar on 5-minute chart EURUSD

ao=iAO(“EURAUD”,PERIOD_W1,1);
// moving force of the last but one bar on a weekly chart EURAUD
熊市力量
熊市力量指标用于评估“熊市”力量的平衡。http://www.fibo-forex.ru/pages.php?page=1799 函数原型:
double iBearsPower(string symbol,int timeframe,int period,int applied_price,int shift)
参数:
- 交易品种 – 定义应该用于技术指标值计算的金融证券(货币对)。如果你需要当前(活动)的证券(图表),则使用 NULL(或 0)。
- 时间范围 – 定义应该使用指标的时间范围(时长)。对当前时期使用 0 或以下常量之一(PERIOD_M1、PERIOD_M5、PERIOD_M15、PERIOD_M30、PERIOD_H1、PERIOD_H4、PERIOD_D1、PERIOD_W1、PERIOD_MN1)。
- period – 柱的数量,用于获取平均值。
- applied_price – 定义要使用的价格(要进行平均的价格)对于选择使用的价格,有以下预定义的常量:
- PRICE_CLOSE - 收盘价格
- PRICE_OPEN - 开盘价格
- PRICE_HIGH - 最高价格
- PRICE_LOW - 最低价格
- PRICE_MEDIAN - 平均价格,(最高价+最低价)/2
- PRICE_TYPICAL - 典型价格,(最高价+最低价+收盘价)/3
- PRICE_WEIGHTED - 加权收盘价格,(最高价+最低价+收盘价+收盘价)/4
- shift – 定义应该使用指标的柱。
使用示例:
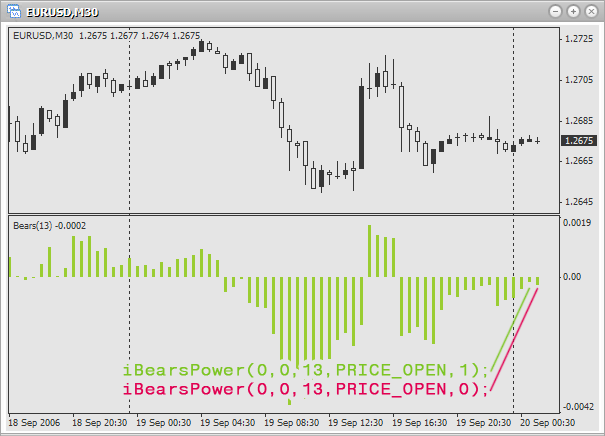
double bp;

bp=iBearsPower(0,0,5,PRICE_OPEN,0);
// balance of the last bar on the active chart and period. Use 5 bars for averaging and opening prpice.

bp=iBearsPower("EURUSD",PERIOD_M5,32,PRICE_CLOSE,1);
// balance of the last but one bar on 5-minute chart EURUSD. Use 32 bars for averaging and close price.

bp=iBearsPower("EURGBP",PERIOD_D1,51,PRICE_MEDIAN,0);
// balance of the last bar on a daily chart EURGBP. Use 51 bars for averaging and average price.
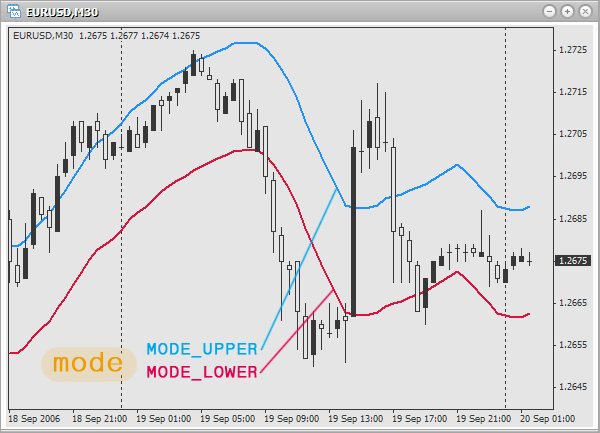
保力加通道技术指标(BB)
保力加通道技术(BB)指标用于确定价格波动正常范围的上限和下限。http://ta.mql4.com/indicators/trends/bollinger_bands 函数原型:
double iBands( string symbol, int timeframe, int period, int deviation, int bands_shift, int applied_price, int mode, int shift)
参数:
- 交易品种 – 定义应该用于技术指标值计算的金融证券(货币对)。如果你需要当前(活动)的证券(图表),则使用 NULL(或 0)。
- 时间范围 – 定义应该使用指标的时间范围(时长)。对当前时期使用 0 或以下常量之一(PERIOD_M1、PERIOD_M5、PERIOD_M15、PERIOD_M30、PERIOD_H1、PERIOD_H4、PERIOD_D1、PERIOD_W1、PERIOD_MN1)。
- period – 柱的数量,用于获取平均值。
- deviation – 与主线的偏差。
- bands_shift - 价格偏移量。
- applied_price – 定义要使用的价格(要进行平均的价格)对于选择使用的价格,有以下预定义的常量:
- PRICE_CLOSE - 收盘价格
- PRICE_OPEN - 开盘价格
- PRICE_HIGH - 最高价格
- PRICE_LOW - 最低价格
- PRICE_MEDIAN - 平均价格,(最高价+最低价)/2
- PRICE_TYPICAL - 典型价格,(最高价+最低价+收盘价)/3
- PRICE_WEIGHTED - 加权收盘价格,(最高价+最低价+收盘价+收盘价)/4
- mode – 选择一条线,将会找到它的值。使用以下预定义的常量:
- MODE_UPPER - 上面线
- MODE_LOWER - 下面线
- shift – 定义应该使用指标的柱。
使用 mode 参数,定义应返回的内容:
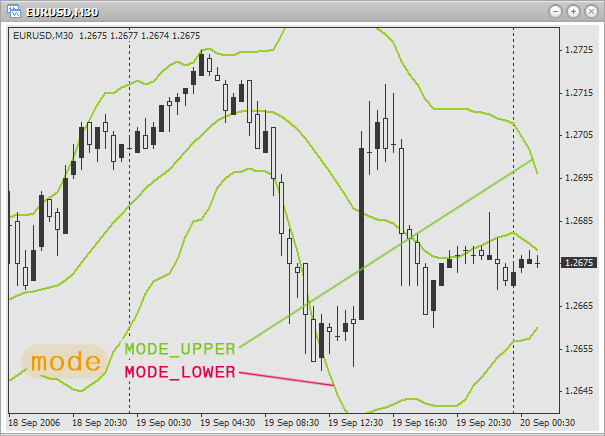
使用示例:
double bb;

bb=iBands
(0,0,20,2,0,PRICE_LOW,MODE_LOWER,0);
// lower limit of the last bar on the active chart and period.
// Use 20 bars for averaging, and the minimal price.
// Deviation from the main line is 2, shift is not used.

bb=iBands("EURUSD",PERIOD_H1,13,2,3,PRICE_HIGH,MODE_UPPER,1);
// upper limit of the last but one bar on an hour chart EURUSD.
// Use 13 bars for averaging, and the maximal price.
// Deviation from the main line is 2, shift is 3 bars.

bb=iBands("EURGBP",PERIOD_D1,21,3,4,PRICE_HIGH,MODE_UPPER,0);
// upper limit of the last bar on a daily chart EURGBP.
// Use 21 bars for averaging, and the maximal price.
// Deviation from the main line is 2, shift is 4 bars.
牛市力量
牛市力量指标用于评估“牛市”力量的平衡。http://www.forexdealer.net/help/bul_hlp.htm 函数原型:
double iBullsPower(string symbol, int timeframe, int period, int applied_price, int shift)
参数:
- 交易品种 – 定义应该用于技术指标值计算的金融证券(货币对)。如果你需要当前(活动)的证券(图表),则使用 NULL(或 0)。
- 时间范围 – 定义应该使用指标的时间范围(时长)。对当前时期使用 0 或以下常量之一(PERIOD_M1、PERIOD_M5、PERIOD_M15、PERIOD_M30、PERIOD_H1、PERIOD_H4、PERIOD_D1、PERIOD_W1、PERIOD_MN1)。
- period – 柱的数量,用于获取平均值。
- applied_price – 定义要使用的价格(要进行平均的价格)对于选择使用的价格,有以下预定义的常量:
- PRICE_CLOSE - 收盘价格
- PRICE_OPEN - 开盘价格
- PRICE_HIGH - 最高价格
- PRICE_LOW - 最低价格
- PRICE_MEDIAN - 平均价格,(最高价+最低价)/2
- PRICE_TYPICAL - 典型价格,(最高价+最低价+收盘价)/3
- PRICE_WEIGHTED - 加权收盘价格,(最高价+最低价+收盘价+收盘价)/4
- shift – 定义应该使用指标的柱。
使用示例:
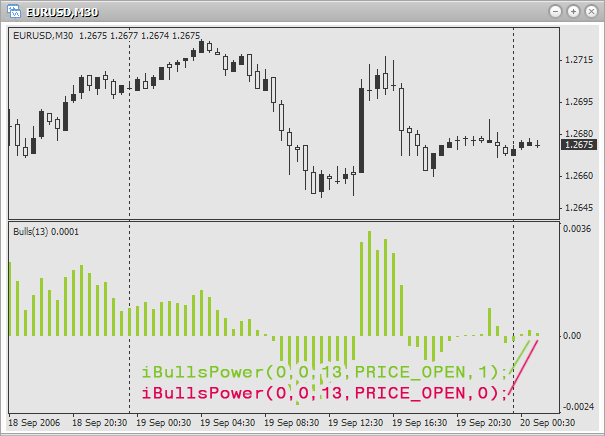
double bp;

bp=iBullsPower(0,0,10,PRICE_CLOSE,1);
// balance of the last but one bar on the active chart and period. Use 10 bars for averaging
// and close price.

bp=iBullsPower("EURGBP",PERIOD_M1,21,PRICE_HIGH,1);
// balance of the last bar on a minute chart EURGBP. Use 21 bars for averaging and the maximal price.

bp=iBullsPower("EURUSD",PERIOD_H1,33,PRICE_MEDIAN,0);
// balance of the last bar on an hour chart EURUSD. Use 33 bars for averaging and the average price.
顺势指标(CCI)
顺势指标(CCI)用于测量价格偏离其平均统计价格的水平。http://ta.mql4.com/indicators/trends/commodity_channel_index 函数原型:
double iCCI( string symbol, int timeframe, int period, int applied_price, int shift)
参数:
- 交易品种 – 定义应该用于技术指标值计算的金融证券(货币对)。如果你需要当前(活动)的证券(图表),则使用 NULL(或 0)。
- 时间范围 – 定义应该使用指标的时间范围(时长)。对当前时期使用 0 或以下常量之一(PERIOD_M1、PERIOD_M5、PERIOD_M15、PERIOD_M30、PERIOD_H1、PERIOD_H4、PERIOD_D1、PERIOD_W1、PERIOD_MN1)。
- period – 柱的数量,用于获取平均值。
- applied_price – 定义要使用的价格(要进行平均的价格)对于选择使用的价格,有以下预定义的常量:
- PRICE_CLOSE - 收盘价格
- PRICE_OPEN - 开盘价格
- PRICE_HIGH - 最高价格
- PRICE_LOW - 最低价格
- PRICE_MEDIAN - 平均价格,(最高价+最低价)/2
- PRICE_TYPICAL - 典型价格,(最高价+最低价+收盘价)/3
- PRICE_WEIGHTED - 加权收盘价格,(最高价+最低价+收盘价+收盘价)/4
- shift – 定义应该使用指标的柱。
使用示例:
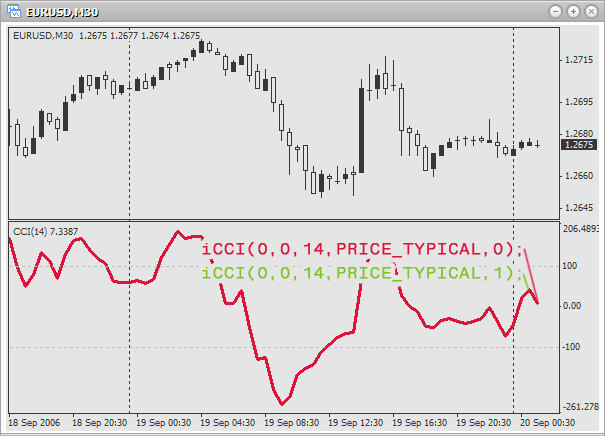
double cci;

cci=iCCI(0,0,14,PRICE_TYPICAL,0);
// index of the last bar on the active chart and period.
// Use 14 bars for finding the mean value and
// typical price.

cci=("EURUSD",PERIOD_M1,21,PRICE_HIGH,1);
// index of the last but one bar on a minute chart EURUSD.
// Use 21 bars for finding the mean value and
// maximal price.

cci=iCCI("EURGBP",PERIOD_D1,7,PRICE_CLOSE,0);
// index of the last bar on a daily chart EURGBP.
// Use 7 bars for finding the mean value and
// close price.
DeMarker (DeM)
DeMarker(DeM)指标是根据历史柱的价格差异预测价格拐点。http://ta.mql4.com/indicators/oscillators/DeMarker 函数原型:
double iDeMarker( string symbol, int timeframe, int period, int shift)
参数:
- 交易品种 – 定义应该用于技术指标值计算的金融证券(货币对)。如果你需要当前(活动)的证券(图表),则使用 NULL(或 0)。
- 时间范围 – 定义应该使用指标的时间范围(时长)。对当前时期使用 0 或以下常量之一(PERIOD_M1、PERIOD_M5、PERIOD_M15、PERIOD_M30、PERIOD_H1、PERIOD_H4、PERIOD_D1、PERIOD_W1、PERIOD_MN1)。
- period – 柱的数量,用于获取平均值。
- shift – 定义应该使用指标的柱。
使用示例:
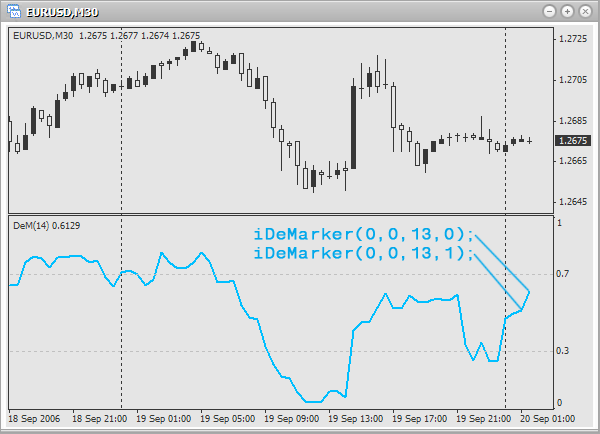
double dm;

dm=iDeMarker(0,0,13,0);
// DeMarker value of the last bar on the current chart and period.
// Use 13 bars to find the mean value.

dm=iDeMarker("EURJPY",PERIOD_H4,51,1);
// DeMarker value of the last but one bar on 4-hour chart EURJPY.
// Use 51 bars to find the mean value.

dm=iDeMarker("USDCAD",PERIOD_M30,21,0);
// DeMarker value of the last bar on 30-minutes chart USDCAD.
// Use 21 bars to find the mean value.
包络线
包络线是基于两条移动平均线确定价格波动的极限值。http://ta.mql4.com/indicators/oscillators/envelopes 函数原型:
double iEnvelopes( string symbol, int timeframe, int ma_period, int ma_method, int ma_shift, int applied_price, double deviation, int mode, int shift)
参数:
- 交易品种 – 定义应该用于技术指标值计算的金融证券(货币对)。如果你需要当前(活动)的证券(图表),则使用 NULL(或 0)。
- 时间范围 – 定义应该使用指标的时间范围(时长)。对当前时期使用 0 或以下常量之一(PERIOD_M1、PERIOD_M5、PERIOD_M15、PERIOD_M30、PERIOD_H1、PERIOD_H4、PERIOD_D1、PERIOD_W1、PERIOD_MN1)。
- ma_period - 柱的数量,用于获取主线。
- ma_method – 定义用于找到平均值的方法。以下预定义的常量用于选择方法:
- MODE_SMA - 简单移动平均线
- MODE_EMA - 指数移动平均线
- MODE_SMMA - 平滑移动平均线
- MODE_LWMA - 线性加权移动平均线
- ma_shift – 柱内指标线的偏移。如果偏移为正,则指标线右移。相反,如果偏移为负,则线左移。
- applied_price – 定义要使用的价格(要进行平均的价格)对于选择使用的价格,有以下预定义的常量:
- PRICE_CLOSE - 收盘价格
- PRICE_OPEN - 开盘价格
- PRICE_HIGH - 最高价格
- PRICE_LOW - 最低价格
- PRICE_MEDIAN - 平均价格,(最高价+最低价)/2
- PRICE_TYPICAL - 典型价格,(最高价+最低价+收盘价)/3
- PRICE_WEIGHTED - 加权收盘价格,(最高价+最低价+收盘价+收盘价)/4
- deviation – 与主线的偏差,以百分比表示。例如,如果写入 0.1,则表示 10%,0.25 则表示 25%,以此类推。
- mode – 选择一条线,将会找到它的值。使用以下预定义的常量:
- MODE_UPPER - 上面线
- MODE_LOWER - 下面线
- shift – 定义应该使用指标的柱。
使用 mode 参数,定义应返回的内容:
使用示例:
double e;

e=iEnvelopes(0,0,21,MODE_SMA,0,PRICE_CLOSE,0.05,MODE_LOWER,0);
// lower limit of the last bar on the active chart and period.
// Use 21 bars and close price for finding the value of simple moving
// average. Shift is not used. Deviation from the main
// line: 5%.

e=iEnvelopes("EURUSD",PERIOD_H1,13,MODE_SMMA,3,PRICE_MEDIAN,0.15,MODE_UPPER,1);
// upper limit of the last but one bar on an hour chart EURUSD.
// Use 13 bars and average price for finding the value of smoothed moving
// average. Shift: 3 bars. Deviation from the main line: 15%.

e=iEnvelopes("EURAUD",PERIOD_D1,7,MODE_EMA,2,PRICE_CLOSE,0.20,MODE_LOWER,0);
// lower limit of the last bar on a daily chart EURAUD.
// Use 7 bars and close price for finding the value of exponential
// moving average. Shift: 2 bars. Deviation from the main
// line: 20%.
强力指数(FRC)
强力指数(FRC)指标用于测量每次上涨时的“牛市”力量以及每次下跌时的“熊市”力量。http://ta.mql4.com/indicators/oscillators/force_index 函数原型:
double iForce( string symbol, int timeframe, int period, int ma_method, int applied_price, int shift)
参数:
- 交易品种 – 定义应该用于技术指标值计算的金融证券(货币对)。如果你需要当前(活动)的证券(图表),则使用 NULL(或 0)。
- 时间范围 – 定义应该使用指标的时间范围(时长)。对当前时期使用 0 或以下常量之一(PERIOD_M1、PERIOD_M5、PERIOD_M15、PERIOD_M30、PERIOD_H1、PERIOD_H4、PERIOD_D1、PERIOD_W1、PERIOD_MN1)。
- period – 柱的数量,用于获取平均值。
- ma_period - 柱的数量,用于获取主线。
- ma_method – 定义一种用于获取平均值的方法。选择一种方法有以下预定义的常量:
- MODE_SMA - 简单移动平均线
- MODE_EMA - 指数移动平均线
- MODE_SMMA - 平滑移动平均线
- MODE_LWMA - 线性加权移动平均线
- applied_price – 定义要使用的价格(要进行平均的价格)对于选择使用的价格,有以下预定义的常量:
- PRICE_CLOSE - 收盘价格
- PRICE_OPEN - 开盘价格
- PRICE_HIGH - 最高价格
- PRICE_LOW - 最低价格
- PRICE_MEDIAN - 平均价格,(最高价+最低价)/2
- PRICE_TYPICAL - 典型价格,(最高价+最低价+收盘价)/3
- PRICE_WEIGHTED - 加权收盘价格,(最高价+最低价+收盘价+收盘价)/4
- shift – 定义应该使用指标的柱。
使用示例:
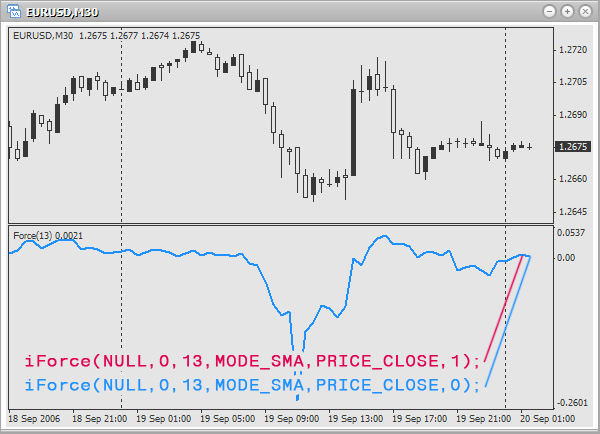
double f;

f=iForce(0,0,13,MODE_SMA,PRICE_CLOSE,0);
// force index of the last bar on the active chart and period. Period
// of averaging: 13 bars. Method of averaging: simple moving average.
// Use close price.

f=iForce("EURGBP",PERIOD_M5,21,MODE_LWMA,PRICE_HIGH,1);
// force index of the last but one bar on 5-minute chart EURGBP. Period
// of averaging: 21 bars. Method of averaging: linearly-weighted moving average.
// Use maximal price.

f=iForce("EURUSD",PERIOD_M1,32,MODE_SMMA,PRICE_MEDIAN,0);
// force index of the last bar on a minute chart EURUSD. Period
// of averaging: 32 bars. Method of averaging: smoothed moving average.
// Use average price.
分形指标
分形指标是比尔·威廉姆交易系统的五大指标之一,用于检测价格图的底部和顶部。分形并不出现在所有柱上。如果分形未出现在柱上,函数返回零。http://ta.mql4.com/indicators/bills/fractal 函数原型:
double iFractals( string symbol, int timeframe, int mode, int shift)
参数:
- 交易品种 – 定义应该用于技术指标值计算的金融证券(货币对)。如果你需要当前(活动)的证券(图表),则使用 NULL(或 0)。
- 时间范围 – 定义应该使用指标的时间范围(时长)。对当前时期使用 0 或以下常量之一(PERIOD_M1、PERIOD_M5、PERIOD_M15、PERIOD_M30、PERIOD_H1、PERIOD_H4、PERIOD_D1、PERIOD_W1、PERIOD_MN1)。
- mode – 选择一条线,将会收到它的值。会使用以下预定义的常量:
- MODE_UPPER - 上分形
- MODE_LOWER - 下分形
- shift – 定义应该使用指标的柱。
使用 mode 参数,定义应返回的内容:
使用示例:
double f;

f=iFractals(0,0,MODE_UPPER,0);
// upper fractal of the last bar on the active chart and
// period.

f=iFractals("USDCAD",PERIOD_M5,MODE_LOWER,1);
// lower fractal of the last but one bar on 5-minute chart
// USDCAD.

f=iFractals("USDJPY",PERIOD_D1,MODE_UPPER,0);
// upper fractal of the last bar on a daily chart USDJPY.
加多摆动指标
加多摆动指标基于鳄鱼指标之上构建,用于测量平衡线的收敛或发散程度。http://ta.mql4.com/indicators/bills/gator 函数原型:
double iGator( string symbol, int timeframe, int jaw_period, int jaw_shift, int teeth_period, int teeth_shift, int lips_period, int lips_shift, int ma_method, int applied_price, int mode, int shift)
参数:
- 交易品种 – 定义应该用于技术指标值计算的金融证券(货币对)。如果你需要当前(活动)的证券(图表),则使用 NULL(或 0)。
- 时间范围 – 定义应该使用指标的时间范围(时长)。对当前时期使用 0 或以下常量之一(PERIOD_M1、PERIOD_M5、PERIOD_M15、PERIOD_M30、PERIOD_H1、PERIOD_H4、PERIOD_D1、PERIOD_W1、PERIOD_MN1)。
- jaw_period - 鳄鱼下颚平均周期(蓝线)
- jaw_shift - 蓝线相对偏移量
- teeth_period - 鳄鱼牙齿平均周期(红线)
- teeth_shift - 红线相对偏移量
- lips_period - 鳄鱼嘴唇平均周期(绿线)
- lips_shift - 绿线相对偏移量
- ma_method – 定义一种用于获取平均值的方法。选择一种方法有以下预定义的常量:
- MODE_SMA - 简单移动平均线
- MODE_EMA - 指数移动平均线
- MODE_SMMA - 平滑移动平均线
- MODE_LWMA - 线性加权移动平均线
- applied_price – 定义要使用的价格(要进行平均的价格)对于选择使用的价格,有以下预定义的常量:
- PRICE_CLOSE - 收盘价格
- PRICE_OPEN - 开盘价格
- PRICE_HIGH - 最高价格
- PRICE_LOW - 最低价格
- PRICE_MEDIAN - 平均价格,(最高价+最低价)/2
- PRICE_TYPICAL - 典型价格,(最高价+最低价+收盘价)/3
- PRICE_WEIGHTED - 加权收盘价格,(最高价+最低价+收盘价+收盘价)/4
- mode – 定义要返回的数据(下颚、牙齿或嘴唇)。对于选择使用常量之一:
- MODE_UPPER - 上柱形图
- MODE_LOWER - 下柱形图
- shift – 定义应该使用指标的柱。
使用 mode 参数,定义应返回的内容:
使用示例:
double g;

g=iGator(0,0,13,8,8,0,0,0,MODE_SMA,PRICE_CLOSE,MODE_UPPER,0);
// upper histogram of the last bar on the active chart and period. Periods of
// averaging for jaw, teeth and lips accordingly: 13,8,8. Shift is not used.
// For averaging use close price and the method of a simple moving average.

g=iGator("EURGBP",PERIOD_M1,21,13,9,4,3,2,MODE_SMMA,PRICE_OPEN,MODE_LOWER,1);
// lower histogram of the last but one bar on a minute chart EURGBP. Periods of
// averaging for jaw, teeth and lips accordingly: 21,13,9. Shifts accordingly:
// 4,3 and 2. For averaging use open price and the method of smoothed
// moving average.

g=iGator("USDCAD",PERIOD_D1,51,21,13,8,5,4,MODE_EMA,PRICE_MEDIAN,MODE_UPPER,0);
// upper histogram of the last bar on a daily chart USDCAD. Periods of
// averaging for jaw, teeth and lips accordingly: 51,21,13. Shifts accordingly: 8,5 and 4.
// For averaging use average price and the method of exponential moving average.
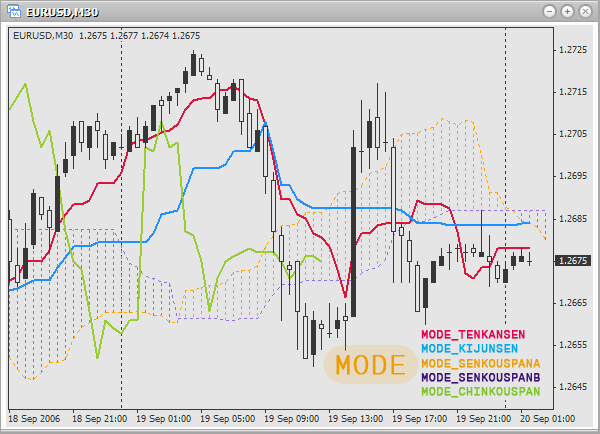
一目平衡表指标
一目平衡表指标用于定义趋势、支撑和阻力位,以及买卖信号。http://ta.mql4.com/indicators/oscillators/ichimoku 函数原型:
double iIchimoku( string symbol, int timeframe, int tenkan_sen, int kijun_sen, int senkou_span_b, int mode, int shift)
参数:
- 交易品种 – 定义应该用于技术指标值计算的金融证券(货币对)。如果你需要当前(活动)的证券(图表),则使用 NULL(或 0)。
- 时间范围 – 定义应该使用指标的时间范围(时长)。对当前时期使用 0 或以下常量之一(PERIOD_M1、PERIOD_M5、PERIOD_M15、PERIOD_M30、PERIOD_H1、PERIOD_H4、PERIOD_D1、PERIOD_W1、PERIOD_MN1)。
- tenkan_sen - 转折线平均周期。
- kijun_sen - 基准线平均周期。
- senkou_span_b - 先行下线平均周期。
- mode - 定义要寻找的值。对于选择使用常量之一:
- MODE_TENKANSEN - 转折线
- MODE_KIJUNSEN - 基准线
- MODE_SENKOUSPANA - 先行上线
- MODE_SENKOUSPANB - 先行下线
- MODE_CHINKOUSPAN - 延迟线
- shift – 定义应该使用指标的柱。
使用 mode 参数,定义应返回的内容:
使用示例:
double i;

i=iIchimoku(0,0,13,21,53,MODE_KIJUNSEN,0);
// the value of the line Kijun-sen on the last bar on the current security and period.
// Periods for finding mean values for Tenkan Sen, Kijun Sen and Senkou Span B
// accordingly: 13,21 and 53.

i=iIchimoku("EURUSD",PERIOD_M5,21,53,96,MODE_TENKANSEN,1);
// the value of the line Tenkan-sen on the last but one bar on 5-minute chart EURUSD.
// Periods for finding mean values for Tenkan Sen, Kijun Sen and Senkou Span B
// accordingly: 21,53 and 96.

i=iIchimoku("USDCAD",PERIOD_D1,3,5,9,MODE_CHINKOUSPAN,0);
// the value of the line Chinkou Span on the last bar on a daily chart USDCAD.
// Periods for finding mean values for Tenkan Sen, Kijun Sen and Senkou Span B
// accordingly: 3,5 and 9.
市场促进指数(BW MFI)
市场促进指数(BW MFI)指标用于测量一次价格变动的价格。http://ta.mql4.com/indicators/bills/market_facilitation_index 函数原型:
double iBWMFI( string symbol, int timeframe, int shift)
参数:
- 交易品种 – 定义应该用于技术指标值计算的金融证券(货币对)。如果你需要当前(活动)的证券(图表),则使用 NULL(或 0)。
- 时间范围 – 定义应该使用指标的时间范围(时长)。对当前时期使用 0 或以下常量之一(PERIOD_M1、PERIOD_M5、PERIOD_M15、PERIOD_M30、PERIOD_H1、PERIOD_H4、PERIOD_D1、PERIOD_W1、PERIOD_MN1)。
- shift – 定义应该使用指标的柱。
使用示例:
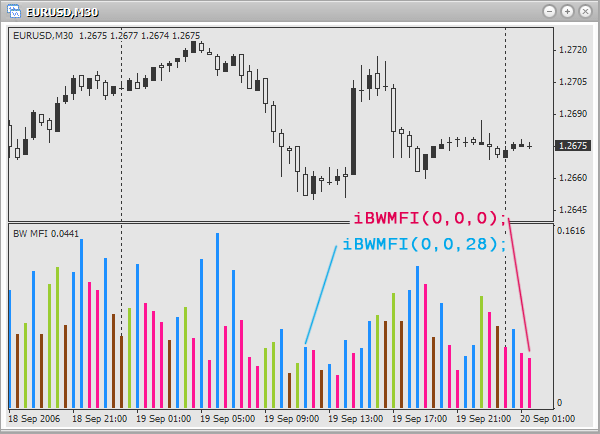
double mfi;

mfi=iBWMFI(0,0,0);
// index of market facilitation of the last bar on the active chart and period.

mfi=iBWMFI("EURUSD",PERIOD_H1,1);
// index of market facilitation of the last but one bar on an hour chart EURUSD.

mfi=iBWMFI("EURGBP",PERIOD_D1,0);
// index of market facilitation of the last bar on a daily chart EURGBP.
动量索引指标
动量索引指标用于测量一段时期内价格的变动量。http://ta.mql4.com/indicators/oscillators/momentum 函数原型:
double iMomentum( string symbol, int timeframe, int period, int applied_price, int shift)
参数:
- 交易品种 – 定义应该用于技术指标值计算的金融证券(货币对)。如果你需要当前(活动)的证券(图表),则使用 NULL(或 0)。
- 时间范围 – 定义应该使用指标的时间范围(时长)。对当前时期使用 0 或以下常量之一(PERIOD_M1、PERIOD_M5、PERIOD_M15、PERIOD_M30、PERIOD_H1、PERIOD_H4、PERIOD_D1、PERIOD_W1、PERIOD_MN1)。
- period – 柱的数量,用于获取平均值。
- applied_price – 定义要使用的价格(要进行平均的价格)对于选择使用的价格,有以下预定义的常量:
- PRICE_CLOSE - 开盘价格
- PRICE_OPEN - 收盘价格
- PRICE_HIGH - 最高价格
- PRICE_LOW - 最低价格
- PRICE_MEDIAN - 平均价格,(最高价+最低价)/2
- PRICE_TYPICAL - 典型价格,(最高价+最低价+收盘价)/3
- PRICE_WEIGHTED - 加权收盘价格,(最高价+最低价+收盘价+收盘价)/4
- shift – 定义应该使用指标的柱。
使用示例:
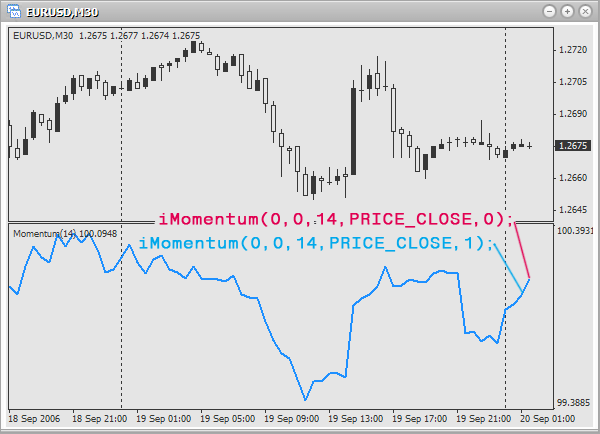
double m;

m=iMomentum(0,0,12,PRICE_CLOSE,1);
// momentum of the last but one bar on the active chart and period. Use
// 12 bars and close price for finding a mean value.

m=iMomentum("EURUSD",PERIOD_D1,21,PRICE_OPEN,0);
// momentum of the last bar on a daily chart EURUSD. Use
// 21 bars and open price for finding a mean value.

m=iMomentum("USDCAD",PERIOD_H1,7,PRICE_MEDIAN,1);
// momentum of the last but one bar on an hour chart USDCAD. Use
// 7 bars and average price for finding a mean value.
资金流量指数(MFI)
资金流量指数(MFI)指标用于测量投资强度。http://ta.mql4.com/indicators/volumes/money_flow_index 函数原型:
double iMFI( string symbol, int timeframe, int period, int shift)
参数:
- 交易品种 – 定义应该用于技术指标值计算的金融证券(货币对)。如果你需要当前(活动)的证券(图表),则使用 NULL(或 0)。
- 时间范围 – 定义应该使用指标的时间范围(时长)。对当前时期使用 0 或以下常量之一(PERIOD_M1、PERIOD_M5、PERIOD_M15、PERIOD_M30、PERIOD_H1、PERIOD_H4、PERIOD_D1、PERIOD_W1、PERIOD_MN1)。
- period – 柱的数量,用于获取平均值。
- shift – 定义应该使用指标的柱。
使用示例:
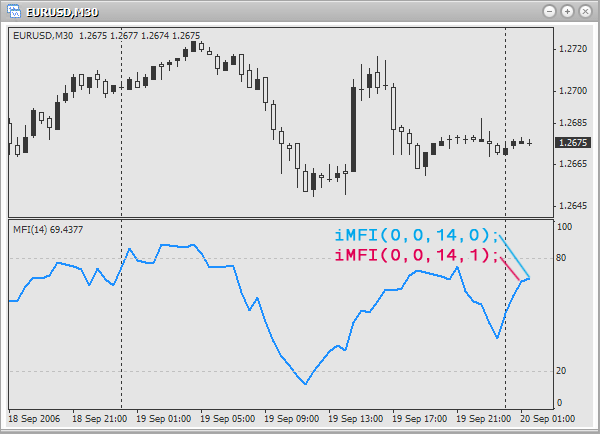
double mfi;

iMFI(0,0,14,1);
// intensity of investments of the last but one bar on the current chart and period.
// Use 14 bars to find the mean value.

iMFI("EURGBP",PERIOD_H4,32,0);
// intensity of investments of the last bar on 4-hour chart EURGBP.
// Use 32 bars to find the mean value.

iMFI("EURUSD",PERIOD_W1,9,1);
// intensity of investments of the last but one bar on a weekly chart EURUSD.
// Use 9 bars to find the mean value.
移动平均线(MA)
移动平均线(MA)指标显示一段时期内的平均价格。http://ta.mql4.com/indicators/trends/moving_average 函数原型:
double iMA( string symbol, int timeframe, int period, int ma_shift, int ma_method, int applied_price, int shift)
参数:
- 交易品种 – 定义应该用于技术指标值计算的金融证券(货币对)。如果你需要当前(活动)的证券(图表),则使用 NULL(或 0)。
- 时间范围 – 定义应该使用指标的时间范围(时长)。对当前时期使用 0 或以下常量之一(PERIOD_M1、PERIOD_M5、PERIOD_M15、PERIOD_M30、PERIOD_H1、PERIOD_H4、PERIOD_D1、PERIOD_W1、PERIOD_MN1)。
- period – 柱的数量,用于获取平均值。
- ma_shift – 柱内线的偏移。如果偏移为正,则线右移。相反,如果偏移为负,则线左移。
- ma_method – 定义一种用于获取平均值的方法。选择一种方法有以下预定义的常量:
- MODE_SMA - 简单移动平均线
- MODE_EMA - 指数移动平均线
- MODE_SMMA - 平滑移动平均线
- MODE_LWMA - 线性加权移动平均线
- applied_price – 定义要使用的价格(要进行平均的价格)对于选择使用的价格,有以下预定义的常量:
- PRICE_CLOSE - 收盘价格
- PRICE_OPEN - 开盘价格
- PRICE_HIGH - 最高价格
- PRICE_LOW - 最低价格
- PRICE_MEDIAN - 平均价格,(最高价+最低价)/2
- PRICE_TYPICAL - 典型价格,(最高价+最低价+收盘价)/3
- PRICE_WEIGHTED - 加权收盘价格,(最高价+最低价+收盘价+收盘价)/4
- shift – 定义应该使用指标的柱。
使用示例:
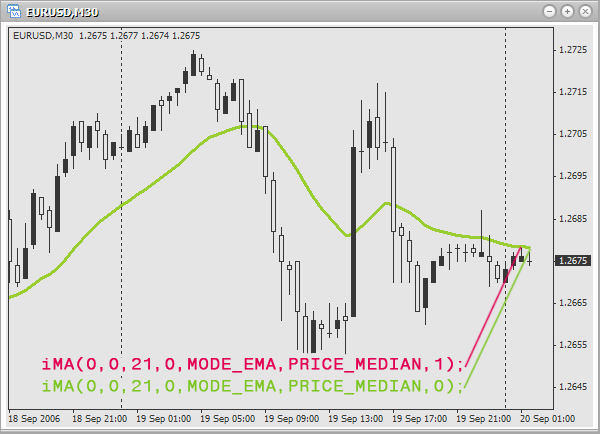
double ma;

ma=iMA(
0,0,13,0,MODE_SMA,PRICE_CLOSE,0);
// moving average of the last bar on the active chart and period.
// Use 13 bars and close price for finding simple moving average.
// Shift is not used.

ma=iMA("GOLD",PERIOD_M15,21,6,MODE_LWMA,PRICE_LOW,1);
// moving average of the last but one bar on 15-minute chart GOLD.
// Use 21 bars and minimal price for finding linearly-weighted moving average.
// Shift: 6 bars.

ma=iMA("EURCHF",PERIOD_D1,18,4,MODE_SMMA,PRICE_TYPICAL,0);
// moving average of the last bar on a daily chart EURCHF.
// Use 18 bars and typical price for finding smoothed moving average.
// Shift: 4 bars.
指数平滑移动平均线(MACD)
指数平滑移动平均线(MACD)指标用于根据两条移动平均线的关联追踪趋势。http://ta.mql4.com/indicators/oscillators/macd 函数原型:
double iMACD( string symbol, int timeframe, int fast_ema_period, int slow_ema_period, int signal_period, int applied_price, int mode, int shift)
参数:
- 交易品种 – 定义应该用于技术指标值计算的金融证券(货币对)。如果你需要当前(活动)的证券(图表),则使用 NULL(或 0)。
- 时间范围 – 定义应该使用指标的时间范围(时长)。对当前时期使用 0 或以下常量之一(PERIOD_M1、PERIOD_M5、PERIOD_M15、PERIOD_M30、PERIOD_H1、PERIOD_H4、PERIOD_D1、PERIOD_W1、PERIOD_MN1)。
- fast_ema_period - 柱的数量,用于计算快速移动平均线。
- slow_ema_period - 柱的数量,用于计算慢速移动平均线。
- signal_period - 柱的数量,用于计算信号线。
- applied_price – 定义要使用的价格(要进行平均的价格)对于选择使用的价格,有以下预定义的常量:
- PRICE_CLOSE - 收盘价格
- PRICE_OPEN - 开盘价格
- PRICE_HIGH - 最高价格
- PRICE_LOW - 最低价格
- PRICE_MEDIAN - 平均价格,(最高价+最低价)/2
- PRICE_TYPICAL - 典型价格,(最高价+最低价+收盘价)/3
- PRICE_WEIGHTED - 加权收盘价格,(最高价+最低价+收盘价+收盘价)/4
- mode - 定义要寻找的值。要进行选择,使用以下常量之一:
- MODE_MAIN - 主线
- MODE_SIGNAL - 信号线
- shift – 定义应该使用指标的柱。
使用 mode 参数,定义应返回的内容:
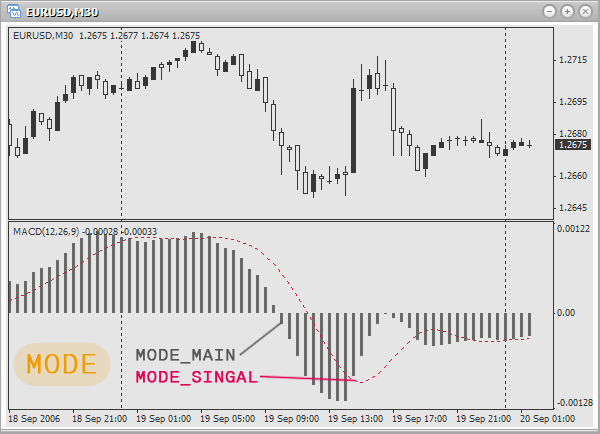
使用示例:
double ma;

ma=iMACD(0,0,9,21,9,PRICE_CLOSE,MODE_MAIN,0);
// value of the main line for the last bar on the active chart and period.
// Bars, used to find mean values of a fast, slow and signal
// moving average accordingly: 9,21 and 9. Use close price.

ma=iMACD("EURUSD",PERIOD_H1,21,52,18,PRICE_HIGH,MODE_SIGNAL,1);
// value of the signal line for the last but one bar on an hour chart EURUSD.
// Bars, used to find mean values of a fast, slow and signal
// moving average accordingly: 21,52 and 18. Use maximal price.

ma=iMACD("USDCAD",PERIOD_D1,7,13,7,PRICE_MEDIAN,MODE_MAIN,1);
// value of the main line for the last but one bar on a daily chart USDCAD.
// Bars, used to find mean values of a fast, slow and signal
// moving average accordingly: 7,13 and 7. Use average price.
移动平均震荡指标(OsMA)
移动平均震荡指标(OsMA)用于测量指数平滑移动平均线指标(MACD)的主线和信号线之间的差异。http://ta.mql4.com/indicators/oscillators/macd_oscillator 函数原型:
double iOsMA( string symbol, int timeframe, int fast_ema_period, int slow_ema_period, int signal_period, int applied_price, int shift)
参数:
- 交易品种 – 定义应该用于技术指标值计算的金融证券(货币对)。如果你需要当前(活动)的证券(图表),则使用 NULL(或 0)。
- 时间范围 – 定义应该使用指标的时间范围(时长)。对当前时期使用 0 或以下常量之一(PERIOD_M1、PERIOD_M5、PERIOD_M15、PERIOD_M30、PERIOD_H1、PERIOD_H4、PERIOD_D1、PERIOD_W1、PERIOD_MN1)。
- fast_ema_period - 柱的数量,用于计算快速移动平均线。
- slow_ema_period - 柱的数量,用于计算慢速移动平均线。
- signal_period - 柱的数量,用于计算信号线。
- applied_price – 定义要使用的价格(要进行平均的价格)对于选择使用的价格,有以下预定义的常量:
- PRICE_CLOSE - 收盘价格
- PRICE_OPEN - 开盘价格
- PRICE_HIGH - 最高价格
- PRICE_LOW - 最低价格
- PRICE_MEDIAN - 平均价格,(最高价+最低价)/2
- PRICE_TYPICAL - 典型价格,(最高价+最低价+收盘价)/3
- PRICE_WEIGHTED - 加权收盘价格,(最高价+最低价+收盘价+收盘价)/4
- shift – 定义应该使用指标的柱。
使用示例:
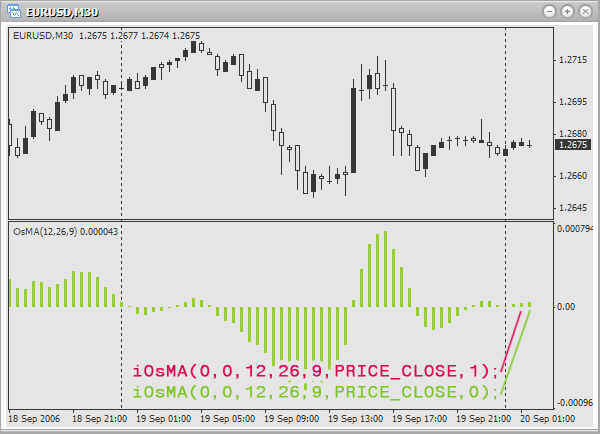
double osma;

osma=iOsMA(0,0,12,26,9,PRICE_CLOSE,0);
// difference of the last bar on the active chart and period. Bars, used
// to find mean values for the fast, slow and signal
// moving average accordingly: 12,26 and 9. Use close price.

osma=iOsMA("EURUSD",PERIOD_M1,7,13,6,PRICE_OPEN,1);
// difference of the last but one bar on a minute chart EURUSD. Bars, used
// to find mean values for the fast, slow and signal
// moving average accordingly: 7,13 and 6. Use open price.

osma=iOsMA("EURAUD",PERIOD_H1,21,48,18,PRICE_TYPICAL,0);
// difference of the last bar on an hour chart EURAUD. Bars, used
// to find mean values for the fast, slow and signal
// moving average accordingly: 21,48 and 18. Use typical price.
能量潮指标(OBV)
能量潮指标(OBV)将交易量跟伴随该交易量的价格变动相关联。http://ta.mql4.com/indicators/volumes/on_balance_volume 函数原型:
double iOBV( string symbol, int timeframe, int applied_price, int shift)
参数:
- 交易品种 – 定义应该用于技术指标值计算的金融证券(货币对)。如果你需要当前(活动)的证券(图表),则使用 NULL(或 0)。
- 时间范围 – 定义应该使用指标的时间范围(时长)。对当前时期使用 0 或以下常量之一(PERIOD_M1、PERIOD_M5、PERIOD_M15、PERIOD_M30、PERIOD_H1、PERIOD_H4、PERIOD_D1、PERIOD_W1、PERIOD_MN1)。
- applied_price – 定义要使用的价格(要进行平均的价格)对于选择使用的价格,有以下预定义的常量:
- PRICE_CLOSE - 收盘价格
- PRICE_OPEN - 开盘价格
- PRICE_HIGH - 最高价格
- PRICE_LOW - 最低价格
- PRICE_MEDIAN - 平均价格,(最高价+最低价)/2
- PRICE_TYPICAL - 典型价格,(最高价+最低价+收盘价)/3
- PRICE_WEIGHTED - 加权收盘价格,(最高价+最低价+收盘价+收盘价)/4
- shift – 定义应该使用指标的柱。
使用示例:
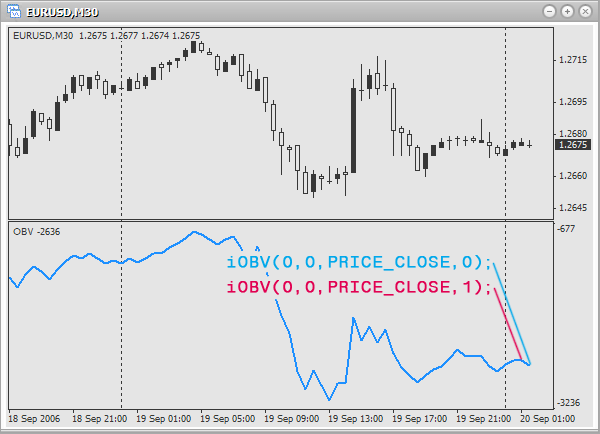
double obv;

obv=iOBV(0,0,PRICE_OPEN,0);
// Balance volume of the last bar on the current chart and period. Use open price

obv=iOBV("GBPCHF",PERIOD_M30,PRICE_CLOSE,1);
// Balance volume of the last but one bar on 30-minutes chart GBPCHF. Use close price.

obv=iOBV("GBPJPY",PERIOD_H4,PRICE_MEDIAN,0);
// Balance volume of the last bar on 4-hour chart GBPJPY. Use average price.
抛物线状止损和反转指标(Parabolic SAR)
抛物线状止损和反转指标(Parabolic SAR)用于分析趋势市场和定义退出点。http://ta.mql4.com/indicators/trends/parabolic_sar 函数原型:
double iSAR( string symbol, int timeframe, double step, double maximum, int shift)
参数:
- 交易品种 – 定义应该用于技术指标值计算的金融证券(货币对)。如果你需要当前(活动)的证券(图表),则使用 NULL(或 0)。
- 时间范围 – 定义应该使用指标的时间范围(时长)。对当前时期使用 0 或以下常量之一(PERIOD_M1、PERIOD_M5、PERIOD_M15、PERIOD_M30、PERIOD_H1、PERIOD_H4、PERIOD_D1、PERIOD_W1、PERIOD_MN1)。
- step - 止损水平的增量,通常为 0.02。
- maximum - 最大止损水平,通常为 0.2。
- shift – 定义应该使用指标的柱。
使用示例:
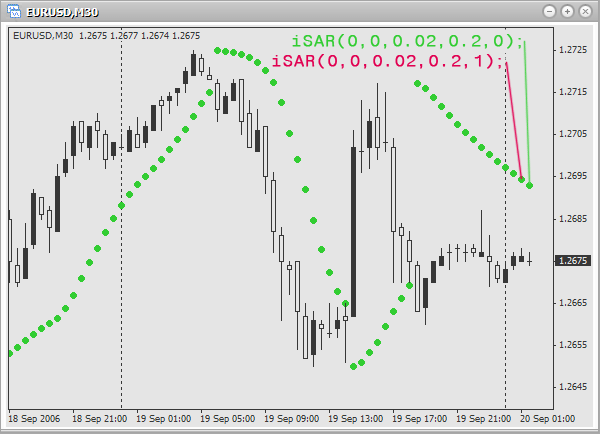
double sar;

sar=iSAR(0,0,0.02,0.2,0);
// indicator value for the last bar on the current chart and period.
// Step of stop level increment: 0.02. Maximal stop level: 0.2.

sar=iSAR("EURUSD",PERIOD_M1,0.03,0.18,1);
// indicator value for the last but one bar on a minute chart EURUSD.
// Step of stop level increment: 0.03. Maximal stop level: 0.18.

sar=iSAR("EURCHF",PERIOD_H1,0.01,0.15,0);
// indicator value for the last bar on an hour chart EURCHF.
// Step of stop level increment: 0.01. Maximal stop level: 0.15.
相对强弱指标(RSI)
相对强弱指标(RSI)用于预测价格拐点。http://ta.mql4.com/indicators/oscillators/relative_strength_index 函数原型:
double iRSI( string symbol, int timeframe, int period, int applied_price, int shift)
参数:
- 交易品种 – 定义应该用于技术指标值计算的金融证券(货币对)。如果你需要当前(活动)的证券(图表),则使用 NULL(或 0)。
- 时间范围 – 定义应该使用指标的时间范围(时长)。对当前时期使用 0 或以下常量之一(PERIOD_M1、PERIOD_M5、PERIOD_M15、PERIOD_M30、PERIOD_H1、PERIOD_H4、PERIOD_D1、PERIOD_W1、PERIOD_MN1)。
- period – 柱的数量,用于获取平均值。
- applied_price – 定义要使用的价格(要进行平均的价格)对于选择使用的价格,有以下预定义的常量:
- PRICE_CLOSE - 收盘价格
- PRICE_OPEN - 开盘价格
- PRICE_HIGH - 最高价格
- PRICE_LOW - 最低价格
- PRICE_MEDIAN - 平均价格,(最高价+最低价)/2
- PRICE_TYPICAL - 典型价格,(最高价+最低价+收盘价)/3
- PRICE_WEIGHTED - 加权收盘价格,(最高价+最低价+收盘价+收盘价)/4
- shift – 定义应该使用指标的柱。
使用示例:
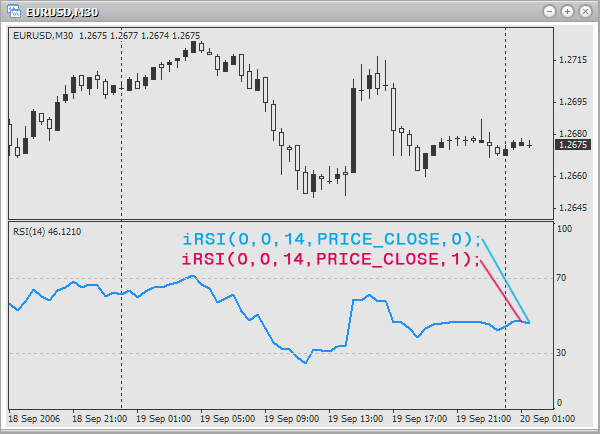
double rsi;

rsi=iRSI(0,0,14,PRICE_CLOSE,0);
// indicator value for the last bar on the active chart and period.
// Use 14 bars and close price to find the mean value.

rsi=iRSI("USDCAD",PERIOD_M1,9,PRICE_OPEN,1);
// indicator value for the last but one bar on a minute chart USDCAD.
// Use 9 bars and close price to find the mean value.

rsi=iRSI("EURAUD",PERIOD_H1,25,PRICE_TYPICAL,0);
// indicator value for the last bar on an hour chart EURAUD.
// Use 25 bars and typical price to find the mean value.
相对活力指数指标(RVI)
相对活力指数指标(RVI)用于确定买卖信号。建议结合上一个指标使用以评估不确定性。http://ta.mql4.com/indicators/oscillators/relative_vigor_index 函数原型:
double iRVI( string symbol, int timeframe, int period, int mode, int shift)
参数:
- 交易品种 – 定义应该用于技术指标值计算的金融证券(货币对)。如果你需要当前(活动)的证券(图表),则使用 NULL(或 0)。
- 时间范围 – 定义应该使用指标的时间范围(时长)。对当前时期使用 0 或以下常量之一(PERIOD_M1、PERIOD_M5、PERIOD_M15、PERIOD_M30、PERIOD_H1、PERIOD_H4、PERIOD_D1、PERIOD_W1、PERIOD_MN1)。
- period – 柱的数量,用于获取平均值。
- mode - 定义要寻找的值。对于选择使用常量之一:
- MODE_MAIN - 主线
- MODE_SIGNAL - 信号线
- shift – 定义应该使用指标的柱。
使用 mode 参数,定义应返回的内容:
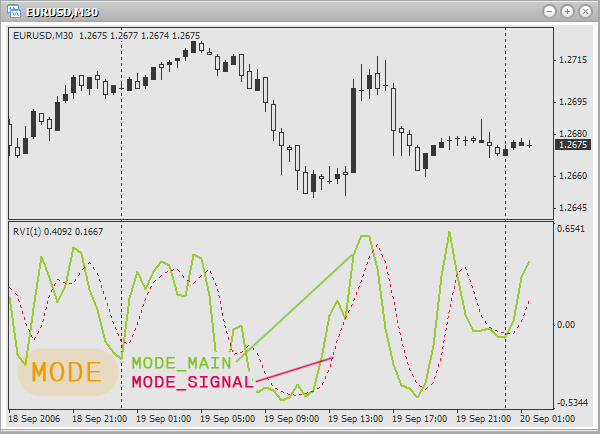
使用示例:
double rvi;

rvi=iRVI(0,0,12,MODE_MAIN,1);
// value of the main line of the last but one bar on the active chart and period.
// Use 12 bars to find the mean value.

rvi=iRVI("EURUSD",PERIOD_D1,21,MODE_SIGNAL,0);
// value of the signal line on the last bar on a daily chart EURUSD.
// Use 21 bars to find the mean value.

rvi=iRVI("GBPJPY",PERIOD_H1,19,MODE_MAIN,1);
// value of the main line on the last but one bar on an hour chart GBPJPY.
// Use 19 bars to find the mean value.
标准离差指标
标准离差指标用于测量市场波动性。http://ta.mql4.com/indicators/trends/standard_deviation 函数原型:
double iStdDev( string symbol, int timeframe, int ma_period, int ma_shift, int ma_method, int applied_price, int shift)
参数:
- 交易品种 – 定义应该用于技术指标值计算的金融证券(货币对)。如果你需要当前(活动)的证券(图表),则使用 NULL(或 0)。
- 时间范围 – 定义应该使用指标的时间范围(时长)。对当前时期使用 0 或以下常量之一(PERIOD_M1、PERIOD_M5、PERIOD_M15、PERIOD_M30、PERIOD_H1、PERIOD_H4、PERIOD_D1、PERIOD_W1、PERIOD_MN1)。
- ma_period - 柱的数量,用于获取指标线。
- ma_shift – 柱内指标线的偏移。如果偏移为正,则线右移。相反,如果偏移为负,则线左移。
- ma_method – 定义一种用于获取平均值的方法。选择一种方法有以下预定义的常量:
- MODE_SMA - 简单移动平均线
- MODE_EMA - 指数移动平均线
- MODE_SMMA - 平滑移动平均线
- MODE_LWMA - 线性加权移动平均线
- applied_price – 定义要使用的价格(要进行平均的价格)对于选择使用的价格,有以下预定义的常量:
- PRICE_CLOSE - 收盘价格
- PRICE_OPEN - 开盘价格
- PRICE_HIGH - 最高价格
- PRICE_LOW - 最低价格
- PRICE_MEDIAN - 平均价格,(最高价+最低价)/2
- PRICE_TYPICAL - 典型价格,(最高价+最低价+收盘价)/3
- PRICE_WEIGHTED - 加权收盘价格,(最高价+最低价+收盘价+收盘价)/4
- shift – 定义应该使用指标的柱。
使用示例:
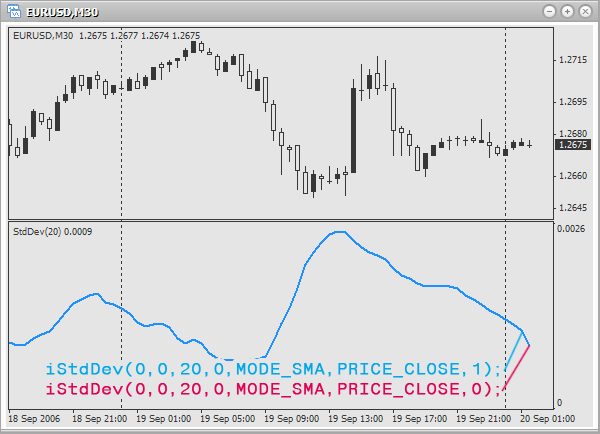
double sd;

sd=iStdDev(0,0,10,0,MODE_SMA,PRICE_CLOSE,1);
// deviation of the last but one bar on the active chart and period.
// Use 10 bars and close price to find simple
// moving average. Shift is not used.

sd=iStdDev("EURUSD",PERIOD_D1,21,3,MODE_SMMA,PRICE_MEDIAN,0);
// deviation of the last bar on a daily chart EURUSD.
// Use 21 bars and average price to find smoothed
// moving average. Shift: 3 bars.

sd=iStdDev("USDCAD",PERIOD_H4,17,2,MODE_EMA,PRICE_OPEN,1);
// deviation of the last but one bar on 4-hour chart USDCAD.
// Use 17 bars and open price to find exponential
// moving average. Shift: 2 bars.
随机震荡指标
随机震荡指标用于确定买卖信号。http://ta.mql4.com/indicators/oscillators/stochastic 函数原型:
double iStochastic( string symbol, int timeframe, int %Kperiod,
                    int %Dperiod, int slowing, int method,
                    int price_field, int mode, int shift)
参数:
- 交易品种 – 定义应该用于技术指标值计算的金融证券(货币对)。如果你需要当前(活动)的证券(图表),则使用 NULL(或 0)。
- 时间范围 – 定义应该使用指标的时间范围(时长)。对当前时期使用 0 或以下常量之一(PERIOD_M1、PERIOD_M5、PERIOD_M15、PERIOD_M30、PERIOD_H1、PERIOD_H4、PERIOD_D1、PERIOD_W1、PERIOD_MN1)。
- %K period - 柱的数量,用于生成 %K 线。
- %D period - 柱的数量,用于生成 %D 线。
- slowing - 滚动值。
- method - 定义一种用于获取平均值的方法。选择一种方法有以下预定义的常量:
- MODE_SMA - 简单移动平均线
- MODE_EMA - 指数移动平均线
- MODE_SMMA - 平滑移动平均线
- MODE_LWMA - 线性加权移动平均线
- price_field – 定义什么价格应该用于计算。价格选择有以下预定义的值:
- 0 - 最低价/最高价
- 1 - 收盘价/收盘价
- mode - 定义要寻找的值。要进行选择,使用以下常量之一:
- MODE_MAIN - 主线
- MODE_SIGNAL- 信号线
- shift – 定义应该使用指标的柱。
使用 mode 参数,定义应返回的内容:
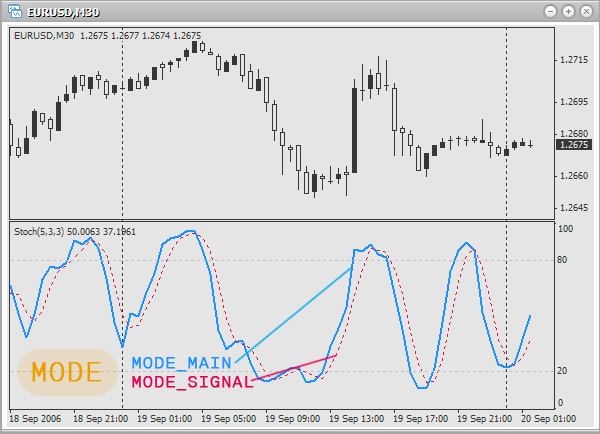
使用示例:
double s;

s=iStochastic(0,0,10,6,6,MODE_SMA,0,MODE_MAIN,0);
// value of the main line for the last bar on the current chart and period.
// Bars used to calculate lines %K, %D and slowing
// accordingly: 10, 6 and 6. Method of averaging: simple moving average.
// Use prices: Low/High.

s=iStochastic("EURUSD",PERIOD_M1,6,3,3,MODE_SMMA,1,MODE_SIGNAL,1);
// value of the signal line for the last but one bar on a minute chart EURUSD.
// Bars used to calculate lines %K, %D and slowing
// accordingly: 6, 3 and 3. Method of averaging: smoothed moving average.
// Use prices: Close/Close.

s=iStochastic("EURGBP",PERIOD_M5,9,7,7,MODE_EMA,0,MODE_MAIN,0);
// value of the main line for the last bar on 5-minute chart EURGBP.
// Bars used to calculate lines %K, %D and slowing
// accordingly: 9, 7 and 7. Method of averaging: exponential moving average.
// Use prices: Low/High.
威廉指标(%R)
威廉指标(%R)用于确定市场是否超买/超卖。http://ta.mql4.com/indicators/oscillators/williams_percent 函数原型:
double iWPR( string symbol, int timeframe, int period, int shift)
参数:
- 交易品种 – 定义应该用于技术指标值计算的金融证券(货币对)。如果你需要当前(活动)的证券(图表),则使用 NULL(或 0)。
- 时间范围 – 定义应该使用指标的时间范围(时长)。对当前时期使用 0 或以下常量之一(PERIOD_M1、PERIOD_M5、PERIOD_M15、PERIOD_M30、PERIOD_H1、PERIOD_H4、PERIOD_D1、PERIOD_W1、PERIOD_MN1)。
- period – 柱的数量,用于获取平均值。
- shift – 定义应该使用指标的柱。
使用示例:
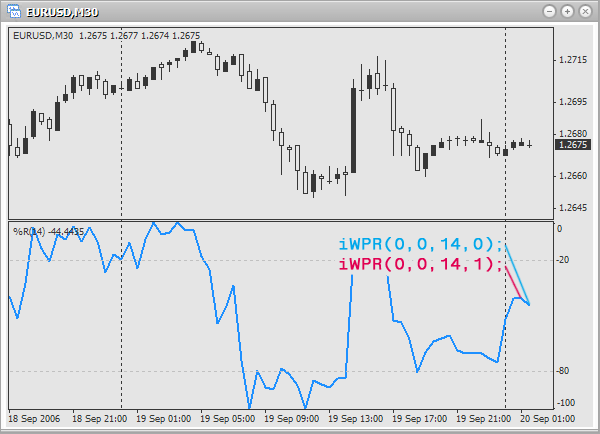
double wpr;

wpr=iWPR(0,0,14,1);
// overbought: the last but one bar on the active chart and period.
// Use 14 bars to get the mean value.

wpr=iWPR("USDCHF",PERIOD_D1,9,0);
// overbought: The last bar on a daily chart USDCHF.
// Use 9 bars to get the mean value.

wpr=iWPR("GBPJPY",PERIOD_H1,23,1);
// overbought: the last but one bar on an hour chart GBPJPY.
// Use 23 bars to get the mean value.
技术指标函数的正确使用
为了正确使用这些函数,你必须确切了解指标是如何工作的以及如何使用它(交易信号)。当然,它们应该用于你自己的 Expert Advisor 或指标。作为家庭作业,你应该尝试编写一个脚本,可以根据任一指标(自行选择)信号通知进场点。作为示例,我们来编写一个家庭作业示例,将基于随机震荡指标的交易信号显示进场点。我们使用以下规则进入市场:如果主线上升高于信号线,则买进。如果主线下跌低于信号线,则卖出。图片中圈出了进入点。
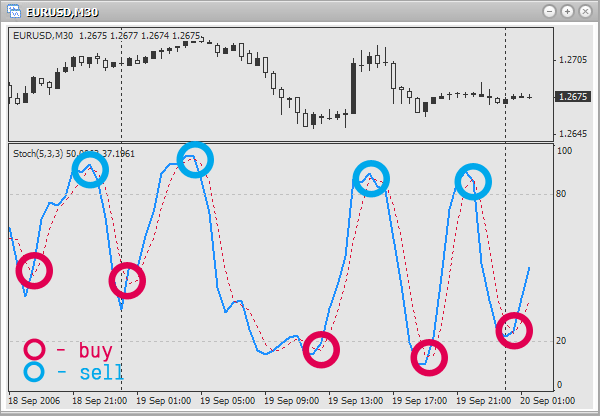
首先,我们来声明几个变量,用于存储信号值和当前以及之前柱的主线。
double mainLine;
double prevMainLine;
double signalLine;
double prevSignalLine;
现在让我们找到这几个变量的值:
mainLine=iStochastic(0,0,5,3,3,MODE_SMA,0,MODE_MAIN,0);
prevMainLine=iStochastic(0,0,5,3,3,MODE_SMA,0,MODE_MAIN,1);
signalLine=iStochastic(0,0,5,3,3,MODE_SMA,0,MODE_SIGNAL,0);
prevSignalLine=iStochastic(0,0,5,3,3,MODE_SMA,0,MODE_SIGNAL,1);
可以看出,我们将自己限于最后和倒数第二个柱。现在来检查是否有买卖信号:
if(prevMainLine<prevSignalLine && mainLine>signalLine)
   Alert("Signal to buy");
// if the main line was under the signal one and rised over it,
// this is a signal to buy

if(prevMainLine>prevSignalLine && mainLine<signalLine)
   Alert("Signal to sell");
// if the main line was over the signal one and fell bellow it,
// this is a signal to sell
我们使用比较运算符和逻辑运算符 &&。尝试对其适当了解。现在我们将其置入循环,检查上百个最后的柱。
for(int a=0;a<100;a++)
{
   mainLine=iStochastic(0,0,5,3,3,MODE_SMA,0,MODE_MAIN,a);
   prevMainLine=iStochastic(0,0,5,3,3,MODE_SMA,0,MODE_MAIN,a+1);
   signalLine=iStochastic(0,0,5,3,3,MODE_SMA,0,MODE_SIGNAL,a);
   prevSignalLine=iStochastic(0,0,5,3,3,MODE_SMA,0,MODE_SIGNAL,a+1);

   if(prevMainLine<prevSignalLine && mainLine>signalLine)
      Alert("Signal to buy");

   if(prevMainLine>prevSignalLine && mainLine<signalLine)
      Alert("Signal to sell");
}
看到了吗?我们直接从循环添加了计数器,可以检验柱。为了简便,我们不用一百,而是声明一个常量 BARS_TO_ANALYSE,来定义要分析的最后柱的个数。以下是脚本的最终版本:
//+------------------------------------------------------------------+
//|                                        showStochasticSignals.mq4 |
//|                                    Antonuk Oleg Copyright © 2007 |
//|                                                   [email protected] |
//+------------------------------------------------------------------+
#property copyright "Antonuk Oleg Copyright © 2007"
#property link      "[email protected]"

#define BARS_TO_ANALYSE 100

//+------------------------------------------------------------------+
//| script program start function                                    |
//+------------------------------------------------------------------+
int start()
{
   double mainLine;
   double prevMainLine;
   double signalLine;
   double prevSignalLine;

   for(int a=0;a<BARS_TO_ANALYSE;a++)
   {
      mainLine=iStochastic(0,0,5,3,3,MODE_SMA,0,MODE_MAIN,a);
      prevMainLine=iStochastic(0,0,5,3,3,MODE_SMA,0,MODE_MAIN,a+1);
      signalLine=iStochastic(0,0,5,3,3,MODE_SMA,0,MODE_SIGNAL,a);
      prevSignalLine=iStochastic(0,0,5,3,3,MODE_SMA,0,MODE_SIGNAL,a+1);

      if(prevMainLine<prevSignalLine && mainLine>signalLine)
         Alert("Signal to buy. Time: ",TimeToStr(Time[a]));

      if(prevMainLine>prevSignalLine && mainLine<signalLine)
         Alert("Signal to sell. Time: ",TimeToStr(Time[a]));
   }
   return(0);
}
在脚本中,以下小段代码一定看起来很陌生(如果是的话,说明你一定是个成功的学生):
TimeToStr(Time[a])
该函数接受自 1970 年 1 月 1 日起的秒数,返回带有该日期的字符串。预定义数组 Time[] 返回跟应用至所选柱相同的秒数。这是一个理想的配对。作为子任务,尝试添加一个长期移动平均线(200-500 的周期),按照以下方法过滤掉不必要的信号:如果价格高于中线,则不卖。如果价格低于中线,则不买。好了,你是否完成了呢?没有?那么,再给你提供一些信息。
关于变量声明的新内容
通常我们这样声明变量:
double maxPrice;
double minPrice;
double lastPrices[100];

int maxIndex;
int minIndex;
int levels[10];
不要再那样做了。而是这样做:
double maxPrice,
       minPrice,
       lastPrices[100];

int maxIndex,
    minIndex,
    levels[10];
也就是说,先指示类型,然后逗号分隔变量(数组)名称。尽管我们避免了不必要的操作,其实没有区别。初始化也一样:
int value1=10,
    value2=12,
    matrix[2][2]={

  1,2,
                  3,4};
返回多个值的函数
是否有这种函数?当然,你可以自己编写。让我们看看你的能耐吧。最简单的函数返回一个值:
int func()
{
   return(100);
}
如果我们需要同时返回多个不同类型的值,该怎么办?请看以下:
void SuperFunc(int& valueForReturn1,double& valueForReturn2,string& valueForReturn3)
{
   valueForReturn1=100;
   valueForReturn2=300.0;
   valueForReturn3="it works!!";
}
现在我们来试着调用“amazing”函数:
int value1=0;
double value2=0.0;
string value3="";

SuperFunc(value1,value2,value3);
MessageBox("value1="+value1+" value2="+value2+" value3="+value3);
结果如下:
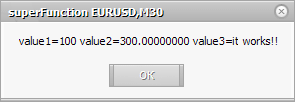
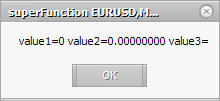
该函数跟简单的函数有一个普遍的差异:当我们声明时,在参数后面放置 ampersand 字符(&)。如果对参数如此处理,可以更改它在函数内的值,且在调用后结果保持不变。这种对参数的处理被称为按引用传递参数。这样可以返回足够多的不同类型的变量。尝试忽略以上代码中的 & 字符并查看结果:
注释的新类型
你知道如何对一个命令行注释:
// it is a one string comment
但有时候为了将其暂时禁用,注释一个代码块更加有用。上述方法不便于对 20-30 个字符串进行注释。这里我们可使用多行注释:
/*
   it is a multi-line comment.
   Very convenient, try it.
*/
总结
今天你学习了很多新内容。我们已经分析了数学和三角函数,以及使用技术指标运算的函数。通过简单的例子你看到了如何正确的追踪交易信号。尽管在脚本中使用它们不太方便,而且它们也并非为此而生,在后续课程你很快就会看到如何在你自己的指标和 Expert Advisor 中使用它们。那时你将看到它们是多么有用。