prometheus+grafana安装和使用流程
作者:蓝眼泪
实验环境:xshell7,xftp7,centos7.9,win7旗舰版,vm15.
关闭防火墙
systemctl stop firewalld
systemctl disable firewalld
iptables -F
第一步,资料准备齐全
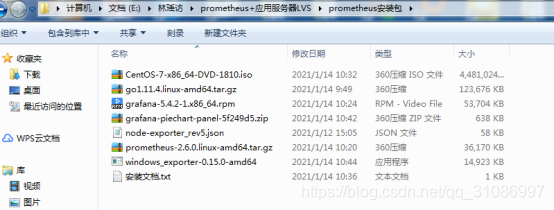
用xftp上传以上资料到centos系统中。路径为/usr/local/host
第二步,安装go软件
解压go软件
tar -C /usr/local/ -xvf go1.11.4.linux-amd64.tar.gz
配置环境变量
vim /etc/profile
export PATH=$PATH:/usr/local/go/bin
source /etc/profile
查看go版本
go version
第三步,安装prometheus软件
解压prometheus软件
tar -C /usr/local/ -xvf prometheus-2.6.0.linux-amd64.tar.gz
ln -sv /usr/local/prometheus-2.6.0.linux-amd64/ /usr/local/Prometheus
启动prometheus软件
/usr/local/Prometheus/prometheus --config.file=/usr/local/Prometheus/prometheus.yml &
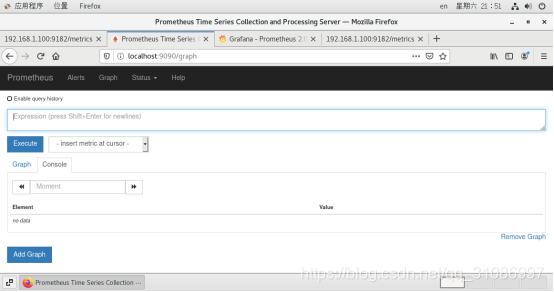
访问prometheus网页
http:\localhost:9090
第四步,安装grafana软件
普罗米修斯默认的页面比较简单,安装grafana可以使监控看起来更直观
安装命令:
rpm -ivh --nodeps grafana-5.4.2-1.x86_64.rpm
wget https://dl.grafana.com/oss/release/grafana-6.7.5-1.x86_64.rpm
sudo yum install grafana-6.7.5-1.x86_64.rpm
wget https://dl.grafana.com/oss/release/grafana-7.1.5-1.x86_64.rpm
sudo yum install grafana-7.1.5-1.x86_64.rpm
启动grafana软件
sudo /bin/systemctl daemon-reload
sudo /bin/systemctl enable grafana-server.service
sudo /bin/systemctl start grafana-server.service
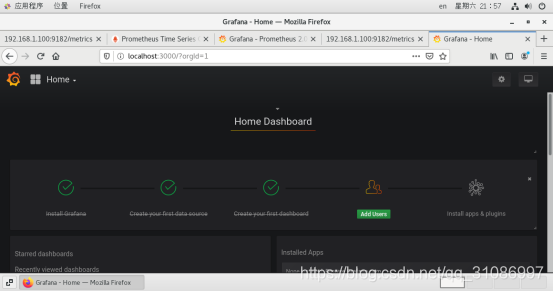
用浏览器访问localhost:3000,即可打开grafana页面,默认用户名密码都是admin,初次登录会要求修改默认的登录密码
确认端口
lsof -i:3000
ss -anltp | grep 9090
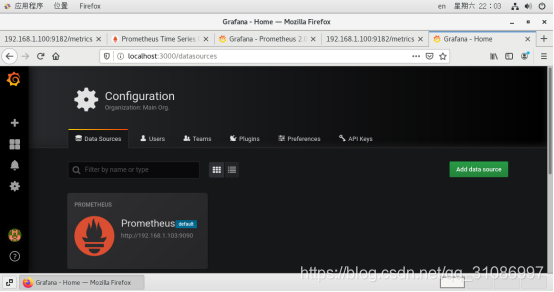
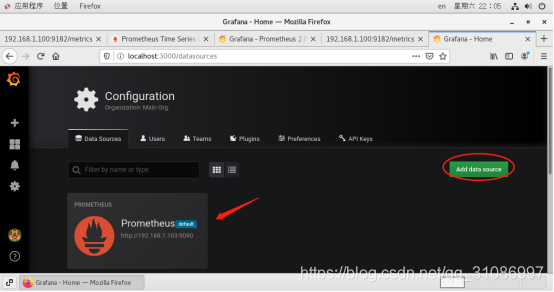
第五步,设置grafana
添加数据源adddatabase,选择prometheus。截图如下:
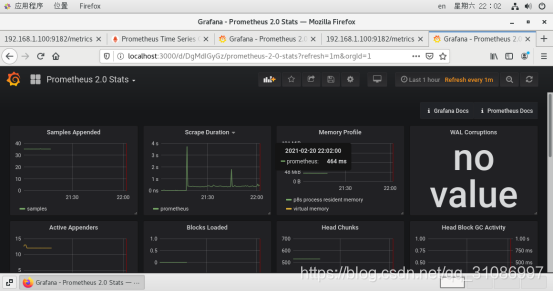
Dashboards页面选择“Prometheus 2.0 Stats”
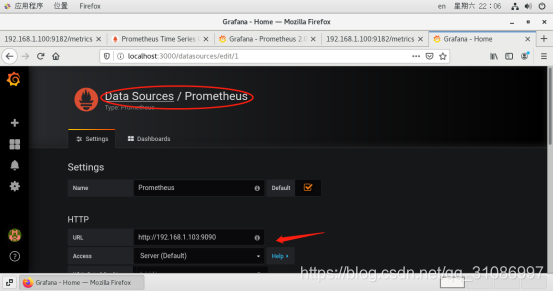
Settings页面填写普罗米修斯地址并保存
换到我们刚才添加的“Prometheus 2.0 Stats”即可看到整个监控页面
第六步,监控linux,windows,mysql,redis。
1.监控linux电脑
在Linux上安装node-exporter
tar -xvf node_exporter-0.17.0.linux-amd64.tar.gz -C /usr/local/
启动node-exporter
/usr/local/node_exporter-0.17.0.linux-amd64/node_exporter &
还可以使用node_exporter启动
nohup /usr/local/node_exporter/node_exporter &
普罗米修斯配置文件添加监控项
vim /usr/local/Prometheus/prometheus.yml
  - job_name: 'Prometheus'
    static_configs:
    - targets: ['192.168.1.103:9100']
      labels:
        instance: Prometheus
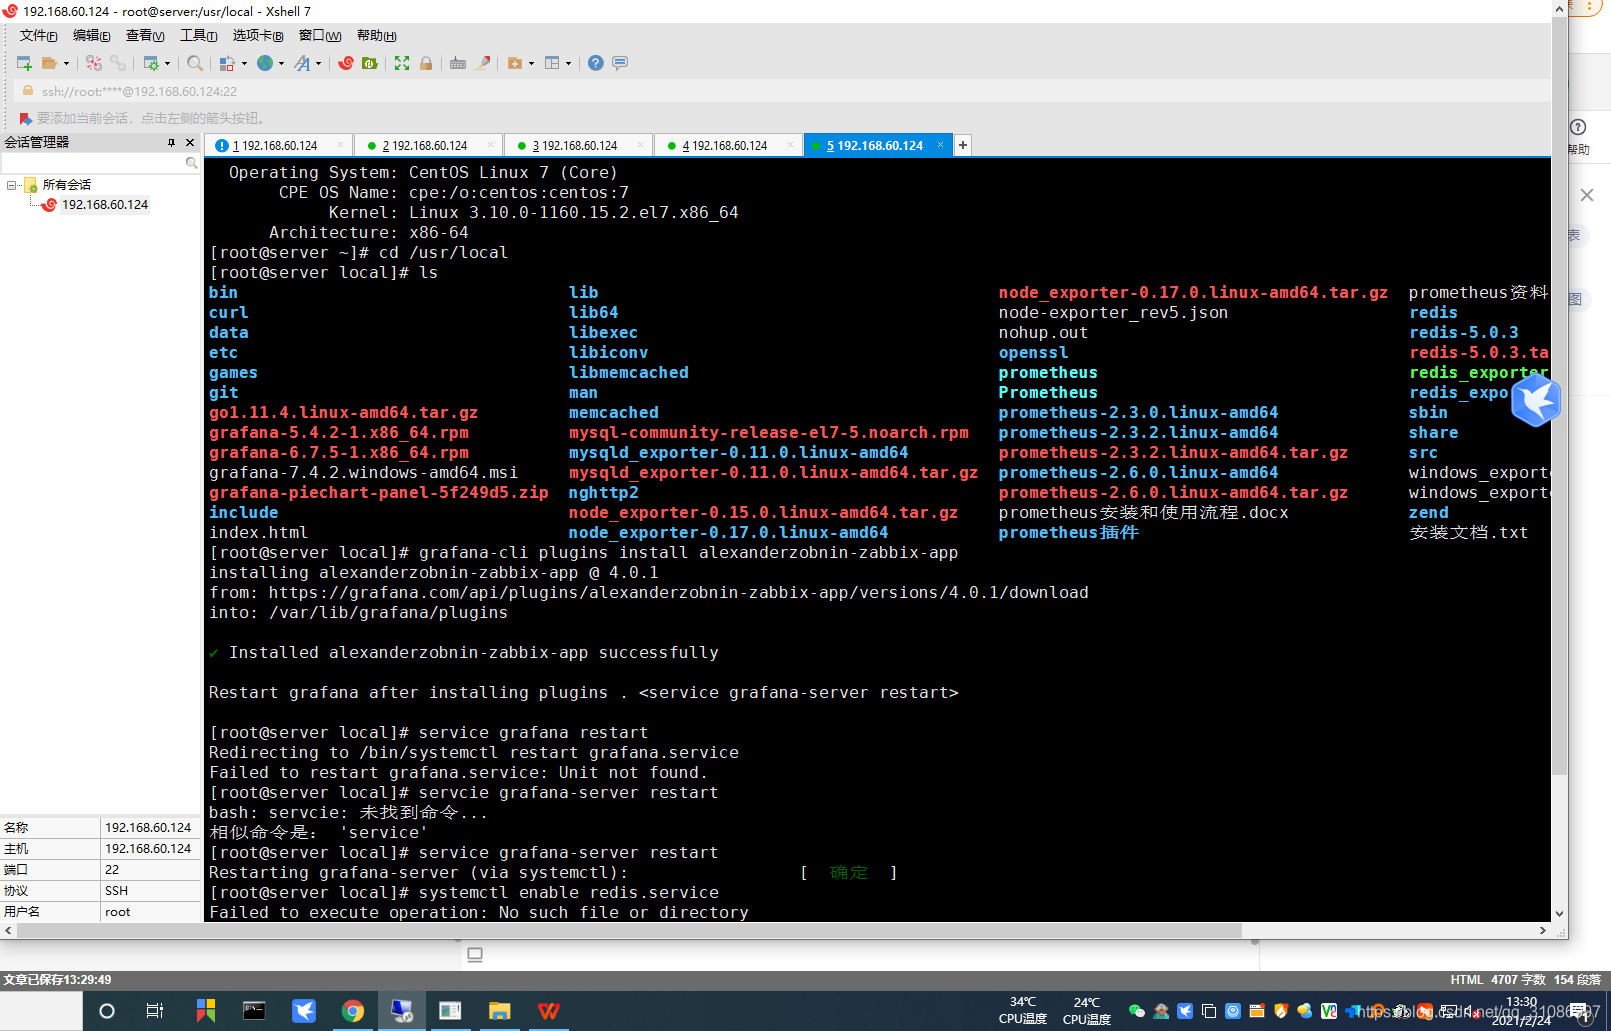
grafana导入画好的dashboard
重启grafana服务
service grafana-server restart
/usr/sbin/grafana-cli plugins ls #查看已安装插件
重启prometheus服务
pkill prometheus
ss -anltp | grep 9090
/usr/local/Prometheus/prometheus --config.file=/usr/local/Prometheus/prometheus.yml &
启动linux监控节点
/usr/local/node_exporter-0.17.0.linux-amd64/node_exporter &
编辑监控项目
vim /usr/local/Prometheus/prometheus.yml
2.监控mysql软件
安装mysql
rpm -qa | grep mysql
rpm -qa|grep -i mariadb
rpm -qa|grep mariadb|xargs rpm -e --nodeps
rpm -qa|grep -i mariadb
wget http://repo.mysql.com/mysql-community-release-el7-5.noarch.rpm
rpm -ivh mysql-community-release-el7-5.noarch.rpm
yum repolist all | grep mysql
yum install mysql-server
rpm -qa | grep mysql
systemctl start mysqld.service #启动 mysql
systemctl restart mysqld.service #重启 mysql
systemctl stop mysqld.service #停止 mysql
systemctl enable mysqld.service #设置 mysql 开机启动
mysql常用文件路径:
/etc/my.cnf 这是mysql的主配置文件
/var/lib/mysql mysql数据库的数据库文件存放位置
/var/logs/mysqld.log 数据库的日志输出存放位置
mysql -u root
mysql> use mysql;
mysql> update user set password=PASSWORD("123456") where User='root';
mysql> flush privileges;
mysql> GRANT ALL PRIVILEGES ON *.* TO root@"%" IDENTIFIED BY "123456";
GRANT ALL PRIVILEGES ON *.* TO root@"%" IDENTIFIED BY "123456";
mysql远程连接权限开通 create user 'root'@'localhost' identified by '123456';
 GRANT REPLICATION CLIENT, PROCESS ON *.* TO 'root'@'localhost';
 GRANT SELECT ON performance_schema.* TO 'root'@'localhost';
 ALTER USER root@localhost IDENTIFIED WITH mysql_native_password BY '123456';
 flush privileges;
3.监控redis软件
安装redis
 yum install -y gcc
wget http://download.redis.io/releases/redis-5.0.3.tar.gz
tar -zxvf redis-5.0.3.tar.gz
cd redis-5.0.3
Make
make install PREFIX=/usr/local/redis
cd /usr/local/redis/bin/
./redis-server
cp /usr/local/redis-5.0.3/redis.conf /usr/local/redis/bin/
修改 redis.conf 文件,把 daemonize no 改为 daemonize yes
vi redis.conf
启动redis
./redis_exporter redis//192.168.1.103:6379 & -web.listenaddress 192.168.1.103:9121
./redis-server redis.conf
vi /etc/systemd/system/redis.service
代码段
[Unit]
Description=redis-server
After=network.target
[Service]
Type=forking
ExecStart=/usr/local/redis/bin/redis-server /usr/local/redis/bin/redis.conf
PrivateTmp=true
[Install]
WantedBy=multi-user.target
设置开机启动
systemctl daemon-reload
 systemctl start redis.service
 systemctl enable redis.service
创建 redis 命令软链接
ln -s /usr/local/redis/bin/redis-cli /usr/bin/redis
测试 redis
redis服务操作命令
systemctl start redis.service   #启动redis服务
systemctl stop redis.service   #停止redis服务
systemctl restart redis.service   #重新启动服务
systemctl status redis.service   #查看服务当前状态
systemctl enable redis.service   #设置开机自启动
systemctl disable redis.service   #停止开机自启动
启动redis监控
./redis_exporter redis//192.168.1.103:6379 & -web.listenaddress 192.168.1.103:9121
./redis_exporter redis//192.168.60.124:6379 & -web.listenaddress 192.168.60.124:9121
4.监控windows电脑
在被监控windows电脑上代理wmi-exporter软件
网址:https://github.com/martinlindhe/wmi_exporter/releases
关于仪表盘json文件可以参考如下:
网址是https://grafana.com/grafana/dashboards/10467