echarts官网教程:
https://github.com/ecomfe/echarts-for-weixin下载地址

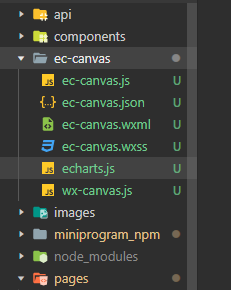
下载后把ec-canvas文件放自己项目中
引入:
在那个文件中使用就在改json中引入
 "usingComponents": {


    "ec-canvas": "../../ec-canvas/ec-canvas"
  }
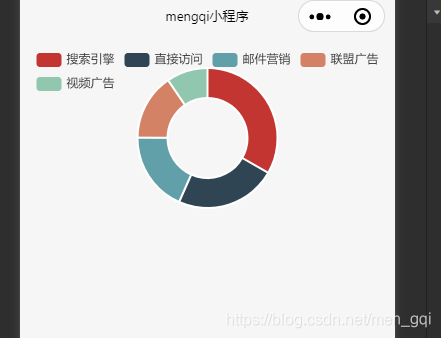
例子:
<view style="width:100%;height:200px;">
  <ec-canvas id="mychart-dom-pie2" canvas-id="mychart-pie2" ec="{

    { ec }}"></ec-canvas>
</view>
import * as echarts from '../../ec-canvas/echarts';

const app = getApp();
let chart = null;
function initChart(canvas, width, height, dpr) {


   chart = echarts.init(canvas, null, {


    width: width,
    height: height,
    devicePixelRatio: dpr // new
  });
  canvas.setChart(chart);
  var option = {


    tooltip: {


      trigger: 'item',
      formatter: '{a} <br/>{b}: {c} ({d}%)'
  },
  legend: {


      top: '5%',
      left: 'center'
  },
  series: [
      {


          name: '访问来源',
          type: 'pie',
          radius: ['40%', '70%'],
          avoidLabelOverlap: false,
          itemStyle: {


              borderRadius: 10,
              borderColor: '#fff',
              borderWidth: 2
          },
          label: {


              show: false,
              position: 'center'
          },
          emphasis: {


              label: {


                  show: true,
                  fontSize: '40',
                  fontWeight: 'bold'
              }
          },
          labelLine: {


              show: false
          },
          data: [
              {

    value: 1048, name: '搜索引擎'},
              {

    value: 735, name: '直接访问'},
              {

    value: 580, name: '邮件营销'},
              {

    value: 484, name: '联盟广告'},
              {

    value: 300, name: '视频广告'}
          ]
      }
  ]
  };

  chart.setOption(option);
  return chart;
}
Page({


  data: {


    ec: {


      onInit: initChart
    }
  },
  onReady() {

     },
  dynamic(){


  chart.setOption(option配置);
   }
});