文章目录
OpenPCDet 中 anchor 的生成是在 anchor_generator.py 这个文件中,仔细看一下,这部分是完全独立的,因此我们可以测试一下这部分,看一下生成的 anchor 到底 ‘长’ 什么样子,以及返回值是什么,方便加深理解。
不多说,先上代码,自己稍微改了一点,加了一些画图的代码
一. 代码
import torch
from easydict import EasyDict
import pdb

import numpy as np
import matplotlib.pyplot as plt

class AnchorGenerator(object):
    def __init__(self, anchor_range, anchor_generator_config):
        super().__init__()
        self.anchor_generator_cfg = anchor_generator_config
        self.anchor_range = anchor_range
        self.anchor_sizes = [config['anchor_sizes'] for config in anchor_generator_config]
        self.anchor_rotations = [config['anchor_rotations'] for config in anchor_generator_config]
        self.anchor_heights = [config['anchor_bottom_heights'] for config in anchor_generator_config]
        self.align_center = [config.get('align_center', False) for config in anchor_generator_config]

        assert len(self.anchor_sizes) == len(self.anchor_rotations) == len(self.anchor_heights)
        self.num_of_anchor_sets = len(self.anchor_sizes)

    def generate_anchors(self, grid_sizes):
        print('generate_anchors!')
        assert len(grid_sizes) == self.num_of_anchor_sets
        all_anchors = []
        num_anchors_per_location = []

        # traverse all type of anchor
        for grid_size, anchor_size, anchor_rotation, anchor_height, align_center in zip(
                grid_sizes, self.anchor_sizes, self.anchor_rotations, self.anchor_heights, self.align_center):
            # print(grid_size, anchor_size, anchor_rotation, anchor_height, align_center)

            num_anchors_per_location.append(len(anchor_rotation) * len(anchor_size) * len(anchor_height))
            # pprint.pprint(num_anchors_per_location)
            if align_center:
                x_stride = (self.anchor_range[3] - self.anchor_range[0]) / grid_size[0]
                y_stride = (self.anchor_range[4] - self.anchor_range[1]) / grid_size[1]
                x_offset, y_offset = x_stride / 2, y_stride / 2
            else:
                x_stride = (self.anchor_range[3] - self.anchor_range[0]) / (grid_size[0] - 1)
                y_stride = (self.anchor_range[4] - self.anchor_range[1]) / (grid_size[1] - 1)
                x_offset, y_offset = 0, 0
                print(x_stride, y_stride, x_offset, y_offset)

            # x_shifts = torch.arange(
            #     self.anchor_range[0] + x_offset, self.anchor_range[3] + 1e-5, step=x_stride, dtype=torch.float32,
            # ).cuda()
            # y_shifts = torch.arange(
            #     self.anchor_range[1] + y_offset, self.anchor_range[4] + 1e-5, step=y_stride, dtype=torch.float32,
            # ).cuda()
            # z_shifts = x_shifts.new_tensor(anchor_height)

            x_shifts = torch.arange(
                self.anchor_range[0] + x_offset, self.anchor_range[3] + 1e-5, step=x_stride, dtype=torch.float32,
            )
            y_shifts = torch.arange(
                self.anchor_range[1] + y_offset, self.anchor_range[4] + 1e-5, step=y_stride, dtype=torch.float32,
            )
            z_shifts = x_shifts.new_tensor(anchor_height)

            X, Y = np.meshgrid(1 * x_shifts.numpy(), 1 * y_shifts.numpy())

            fig = plt.figure(figsize=(10, 6))
            ax = fig.add_subplot(111)

            ax.spines['top'].set_color('none')
            ax.spines['right'].set_color('none')

            ax.xaxis.set_ticks_position('bottom')
            ax.spines['bottom'].set_position(('data', 0))
            ax.yaxis.set_ticks_position('left')
            ax.spines['left'].set_position(('data', 0))

            plt.plot(X, Y,
                     color='limegreen',  # 设置颜色为limegreen
                     marker='.',  # 设置点类型为圆点
                     markersize=1,  # 点设置大一点,看着清楚
                     # linestyle='-.')  # 设置线型为空,也即没有线连接点
                     linestyle = ' ')  # 设置线型为空,也即没有线连接点

            num_anchor_size, num_anchor_rotation = anchor_size.__len__(), anchor_rotation.__len__()
            anchor_rotation = x_shifts.new_tensor(anchor_rotation)  # torch.Size([2])
            anchor_size = x_shifts.new_tensor(anchor_size)          # torch.Size([1, 3])


            x_shifts, y_shifts, z_shifts = torch.meshgrid([x_shifts, y_shifts, z_shifts])  # [x_grid, y_grid, z_grid] # torch.Size([176, 200, 1]) torch.Size([176, 200, 1]) torch.Size([176, 200, 1])

            # print(x_shifts, y_shifts, z_shifts)
            # print(x_shifts.shape, y_shifts.shape, z_shifts.shape)

            anchors = torch.stack((x_shifts, y_shifts, z_shifts), dim=-1)  # [x, y, z, 3]  # torch.Size([176, 200, 1, 3])
            anchors = anchors[:, :, :, None, :].repeat(1, 1, 1, anchor_size.shape[0], 1)
            anchor_size = anchor_size.view(1, 1, 1, -1, 3).repeat([*anchors.shape[0:3], 1, 1])
            anchors = torch.cat((anchors, anchor_size), dim=-1)
            anchors = anchors[:, :, :, :, None, :].repeat(1, 1, 1, 1, num_anchor_rotation, 1)
            anchor_rotation = anchor_rotation.view(1, 1, 1, 1, -1, 1).repeat([*anchors.shape[0:3], num_anchor_size, 1, 1])
            anchors = torch.cat((anchors, anchor_rotation), dim=-1)  # [x, y, z, num_size, num_rot, 7] # torch.Size([176, 200, 1, 1, 2, 7])

            anchors = anchors.permute(2, 1, 0, 3, 4, 5).contiguous() # torch.Size([1, 200, 176, 1, 2, 7])
            anchors[..., 2] += anchors[..., 5] / 2  # shift to box centers  # in hight dim
            all_anchors.append(anchors)

            for_vis = True

            if for_vis:

                # print(anchors[0, 0, 0, 0, 0, :])
                x_center = anchors.view(-1, 7).numpy()[:,0]
                x_center = np.asarray(x_center, dtype=np.float)
                y_center = anchors.view(-1, 7).numpy()[:,1]
                y_center = np.asarray(y_center, dtype=np.float)
                l = anchors.view(-1, 7).numpy()[:,3]
                l = np.asarray(l, dtype=np.float)
                w = anchors.view(-1, 7).numpy()[:,4]
                w = np.asarray(w, dtype=np.float)

                x_min = x_center - l / 2.
                x_max = x_center + l / 2.
                y_min = y_center - w / 2.
                y_max = y_center + w / 2.

                x_min = x_min[:, np.newaxis]
                x_max = x_max[:, np.newaxis]
                y_min = y_min[:, np.newaxis]
                y_max = y_max[:, np.newaxis]

                coor = np.hstack((x_min, y_min, x_max, y_max))
                print(coor, coor.shape)

                # for i in range(0,coor.shape[0]):
                for i in range(10000, 10001):
                    plt.gca().add_patch(plt.Rectangle(xy = (coor[i][0], coor[i][1]),
                                                      width = coor[i][2] - coor[i][0],
                                                      height = coor[i][3] - coor[i][1],
                                                      edgecolor='red',
                                                      fill = False, linewidth=2))

                    plt.scatter((coor[i][2] + coor[i][0])/2., (coor[i][3] + coor[i][1])/2., marker='x', color='blue', s=20)

                    plt.gca().text(coor[i][0], coor[i][3], 'car', size='small', color='white', bbox={

    'facecolor': 'green', 'alpha': 1.0})

                # # 设置坐标轴范围
                # plt.xlim((POINT_CLOUD_RANGE[0], POINT_CLOUD_RANGE[3]))
                # plt.ylim((POINT_CLOUD_RANGE[1], POINT_CLOUD_RANGE[4]))
                # # 设置坐标轴刻度
                # my_x_ticks = np.arange(POINT_CLOUD_RANGE[0], POINT_CLOUD_RANGE[3], 5)
                # my_y_ticks = np.arange(POINT_CLOUD_RANGE[1], POINT_CLOUD_RANGE[4] + 0.001, 5)
                # plt.xticks(my_x_ticks)
                # plt.yticks(my_y_ticks)
                plt.grid(True)
                plt.title("anchor in bev ")
                plt.xlabel('x')
                plt.ylabel('y')
                plt.show()

            return all_anchors, num_anchors_per_location


if __name__ == '__main__':

    # from easydict import EasyDict
    #
    # config = [
    #     EasyDict({


    #         'anchor_sizes': [[2.1, 4.7, 1.7], [0.86, 0.91, 1.73], [0.84, 1.78, 1.78]],
    #         'anchor_rotations': [0, 1.57],
    #         # 'anchor_heights': [0, 0.5]
    #         'anchor_bottom_heights': [0, 0.5]
    #     })
    # ]
    #
    # A = AnchorGenerator(
    #     anchor_range=[-75.2, -75.2, -2, 75.2, 75.2, 4],
    #     anchor_generator_config=config
    # )
    #
    # import pdb
    #
    # pdb.set_trace()
    # A.generate_anchors([[188, 188]])

    config = [
        {


            'class_name': 'Car',
            'anchor_sizes': [[3.9, 1.6, 1.56]],
            'anchor_rotations': [0, 1.57],
            'anchor_bottom_heights': [-1.78],
            'align_center': False,
            'feature_map_stride': 8,
            'matched_threshold': 0.6,
            'unmatched_threshold': 0.45
        },
        {


            'class_name': 'Pedestrian',
            'anchor_sizes': [[0.8, 0.6, 1.73]],
            'anchor_rotations': [0, 1.57],
            'anchor_bottom_heights': [-0.6],
            'align_center': False,
            'feature_map_stride': 8,
            'matched_threshold': 0.5,
            'unmatched_threshold': 0.35
        },
        {


            'class_name': 'Cyclist',
            'anchor_sizes': [[1.76, 0.6, 1.73]],
            'anchor_rotations': [0, 1.57],
            'anchor_bottom_heights': [-0.6],
            'align_center': False,
            'feature_map_stride': 8,
            'matched_threshold': 0.5,
            'unmatched_threshold': 0.35
        }
    ]

    POINT_CLOUD_RANGE =  [0, -40, -3, 70.4, 40, 1]

    VOXEL_SIZE =  [0.05, 0.05, 0.1]

    grid_size = (np.array(POINT_CLOUD_RANGE[3:6]) - np.array(POINT_CLOUD_RANGE[0:3])) / np.array(VOXEL_SIZE)
    grid_size = np.round(grid_size).astype(np.int64)

    feature_map_size = [grid_size[:2] // _config['feature_map_stride'] for _config in config]

    A = AnchorGenerator(
        anchor_range = POINT_CLOUD_RANGE,
        anchor_generator_config = config
    )

    all_anchors, num_anchors_per_location = A.generate_anchors(feature_map_size)
二. 结果
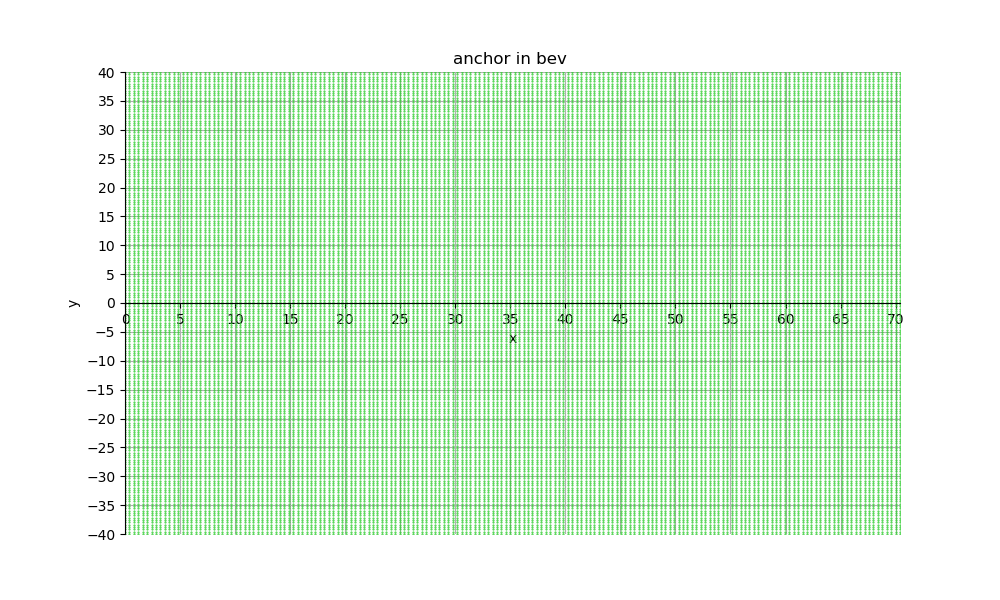
1. anchor 中心
长这个样子:
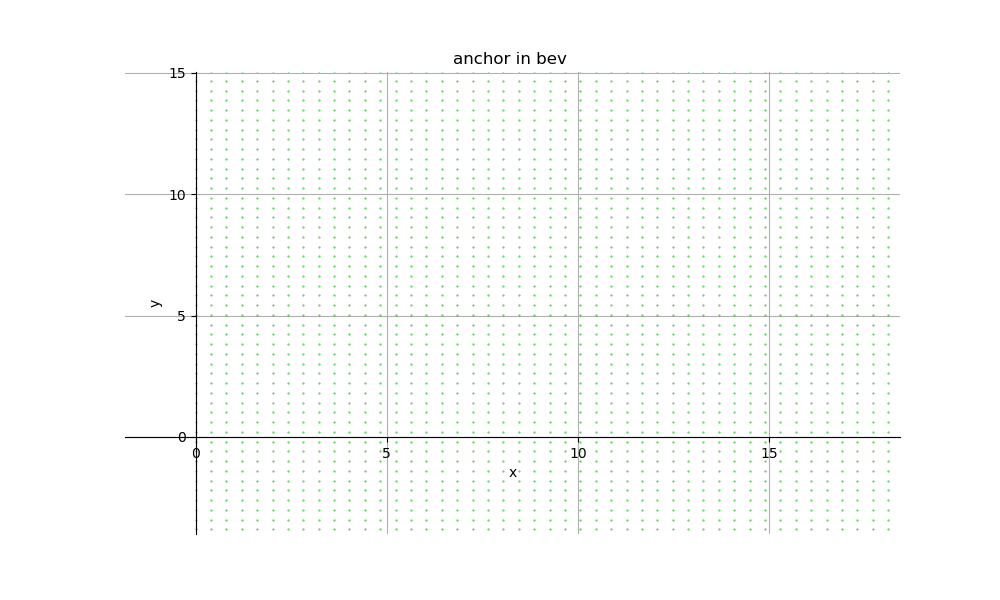
然后我们放大看一下:
2. anchor
这里以 type = car 为例子,可视化完整的 anchor:

只可视化一个,放大些清楚的看一下:
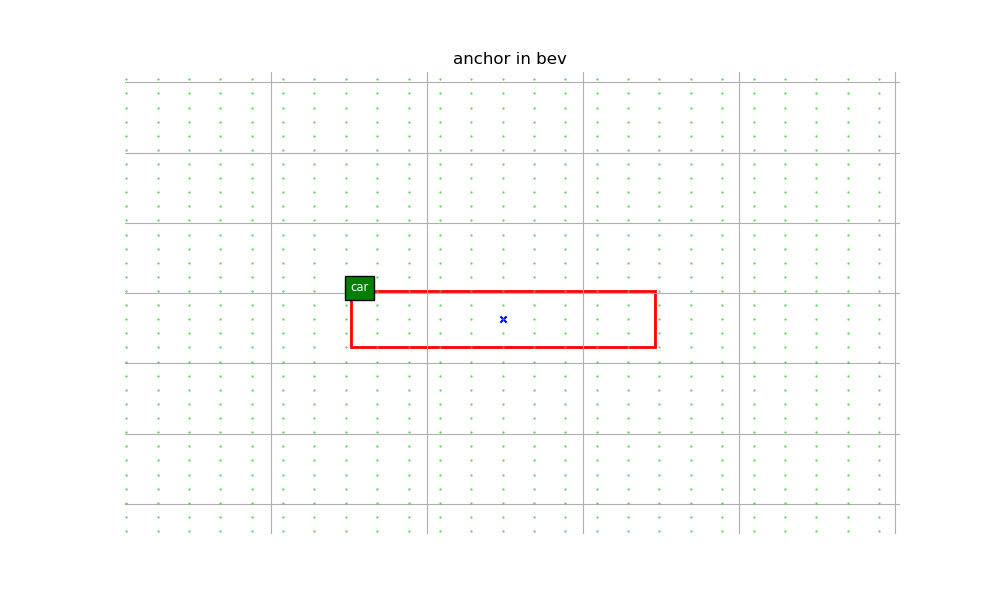
三. 理解
通过具体的把 anchor 可视化出来,可以加深了对于 anchor 这个概念的理解,更加具体化。目标检测领域里面,想要让网络直接学出来目标框,是很难的,学出来也不准确。anchor 的作用就相当于我先给定了许多大概的框,在这个基础上,网络再进行学习,进而得到准确的 bounding box。