Python、Matplot的subplot实现一行3列的子图绘制,并添加背景色
1. 可能遇到的问题
AttributeError: ‘AxesSubplot’ object has no property ‘axisbg’
问题描述:使用 Matplotlib subplot绘制2行2列的子图,并带有背景色时报如上错误
错误原因,subplot中没有 axisbg 属性
解决办法:把axisbg 改成 facecolor
2. 示例
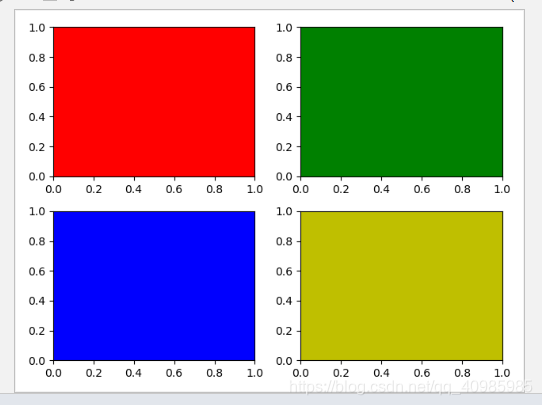
1)绘制2*2(俩行俩列)的子图,并设置背景色
#!/usr/bin/env python
# !encoding=utf-8

import matplotlib.pyplot as plt

if __name__ == '__main__':
    for i, color in enumerate("rgby"):
        # 报错:AttributeError: 'AxesSubplot' object has no property 'axisbg'
        # plt.subplot(221 + i, axisbg=color)
        # 成功
        plt.subplot(221 + i, facecolor=color)

    plt.show()
修改后成功如图:
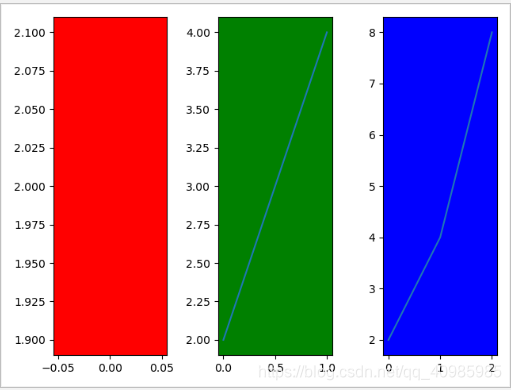
2) 绘制1*3(一行三列)的子图,并设置横轴纵轴值
#!/usr/bin/env python
# !encoding=utf-8

import matplotlib.pyplot as plt
import numpy as np

if __name__ == '__main__':

    for i, color in enumerate("rgb"):
        # 报错:AttributeError: 'AxesSubplot' object has no property 'axesbg'
        # plt.subplot(221 + i, axesbg=color)
        # 成功
        plt.subplot(131 + i, facecolor=color)
        # x轴等差数列,y轴等比数列
        x = i + 1
        x1 = np.arange(0, x, 1)
        y1 = np.logspace(1, x, num=x, base=2)
        print(x1, ' ', y1)
        plt.plot(x1, y1)

    plt.show()
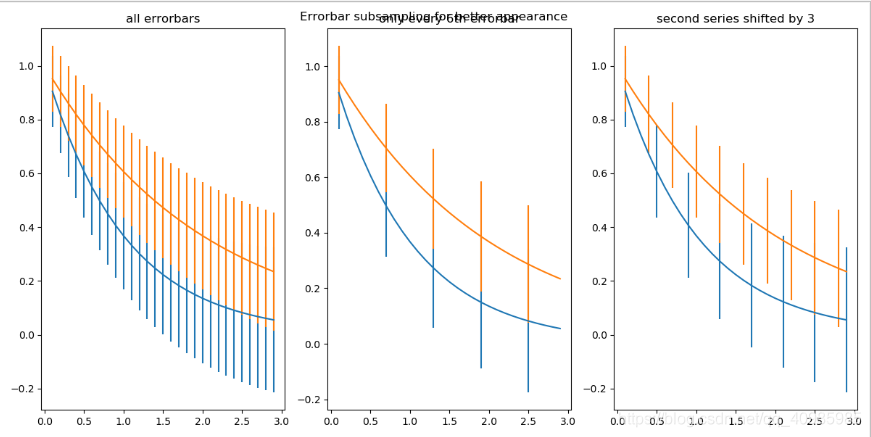
3)绘制1*3(一行三列)的复杂子图
import numpy as np
import matplotlib.pyplot as plt

# example data
x = np.arange(0.1, 4, 0.1)
y1 = np.exp(-1.0 * x)
y2 = np.exp(-0.5 * x)

# example variable error bar values
y1err = 0.1 + 0.1 * np.sqrt(x)
y2err = 0.1 + 0.1 * np.sqrt(x / 2)

# Now switch to a more OO interface to exercise more features.
fig, (ax_l, ax_c, ax_r) = plt.subplots(nrows=1, ncols=3,
                                       sharex=True, figsize=(12, 6))

ax_l.set_title('all errorbars')
ax_l.errorbar(x, y1, yerr=y1err)
ax_l.errorbar(x, y2, yerr=y2err)

ax_c.set_title('only every 6th errorbar')
ax_c.errorbar(x, y1, yerr=y1err, errorevery=6)
ax_c.errorbar(x, y2, yerr=y2err, errorevery=6)

ax_r.set_title('second series shifted by 3')
ax_r.errorbar(x, y1, yerr=y1err, errorevery=4)
ax_r.errorbar(x, y2, yerr=y2err, errorevery=3)

fig.suptitle('Errorbar subsampling for better appearance')
plt.show()
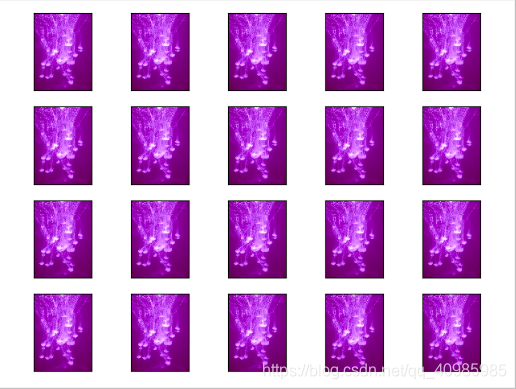
4)将多个图4*5(四行五列)显示在一张图像上
import os

import matplotlib.image as mpimg
import matplotlib.pyplot as plt

folder_path = os.getcwd().replace('\\', '/')
imgpath = folder_path + "/images/001.jpg"
# matplot读出来是RGB
image = mpimg.imread(imgpath)

for i in range(20):
    plt.subplot(4, 5, i + 1)
    plt.imshow(image)  # 通过for循环逐个显示图像
    plt.xticks([])  # 去掉x轴的刻度
    plt.yticks([])  # 去掉y轴的刻度
plt.show()