Echarts 更换柱状图样式 渐变色+圆角
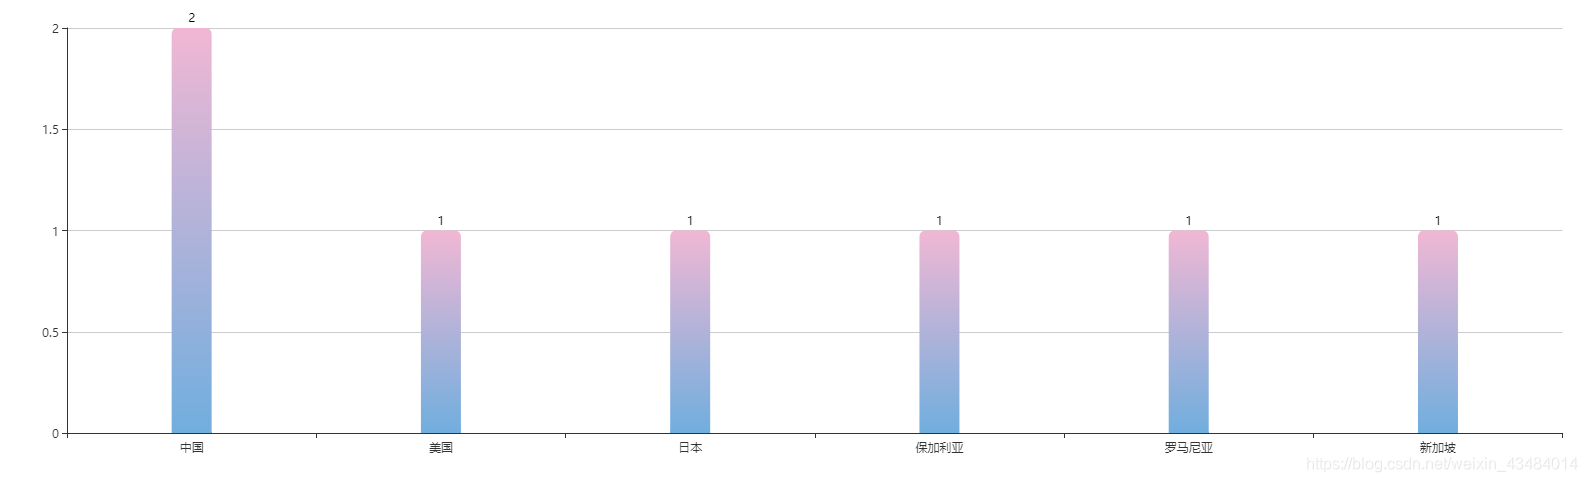
这个是实现之后的效果(自古粉蓝出CP)
需要在 series 中进行定义,下面是整个 series 代码
series: [{


          name: '节点数量',
          type: 'bar',
          data: series,
          barWidth: 40, // 柱图宽度
          itemStyle: {


            emphasis: {


              barBorderRadius: [7, 7, 0, 0]
            },
            normal: {


              barBorderRadius: [7, 7, 0, 0],
              color: function(params) {


                return new echarts.graphic.LinearGradient(0, 1, 0, 0, [{


                  offset: 0,
                  color: '#70aede' // 0% 处的颜色
                },
                  {


                    offset: 1,
                    color: '#f1b7d4' // 100% 处的颜色
                  }
                ], false)
              }
            }
          },
          label: {


            normal: {


              show: true,
              position: 'top'
            }
          }
        }]
实现圆角的代码如下:其中 [7, 7, 0, 0] 代表的分别是左上、右上、右下、左下的圆角
emphasis: {


              barBorderRadius: [7, 7, 0, 0]
            },
            normal: {


              barBorderRadius: [7, 7, 0, 0]
			}
实现渐变的代码如下:
color: function(params) {


                return new echarts.graphic.LinearGradient(0, 1, 0, 0, [{


                  offset: 0,
                  color: '#70aede' // 0% 处的颜色
                },
                  {


                    offset: 1,
                    color: '#f1b7d4' // 100% 处的颜色
                  }
                ], false)
              }