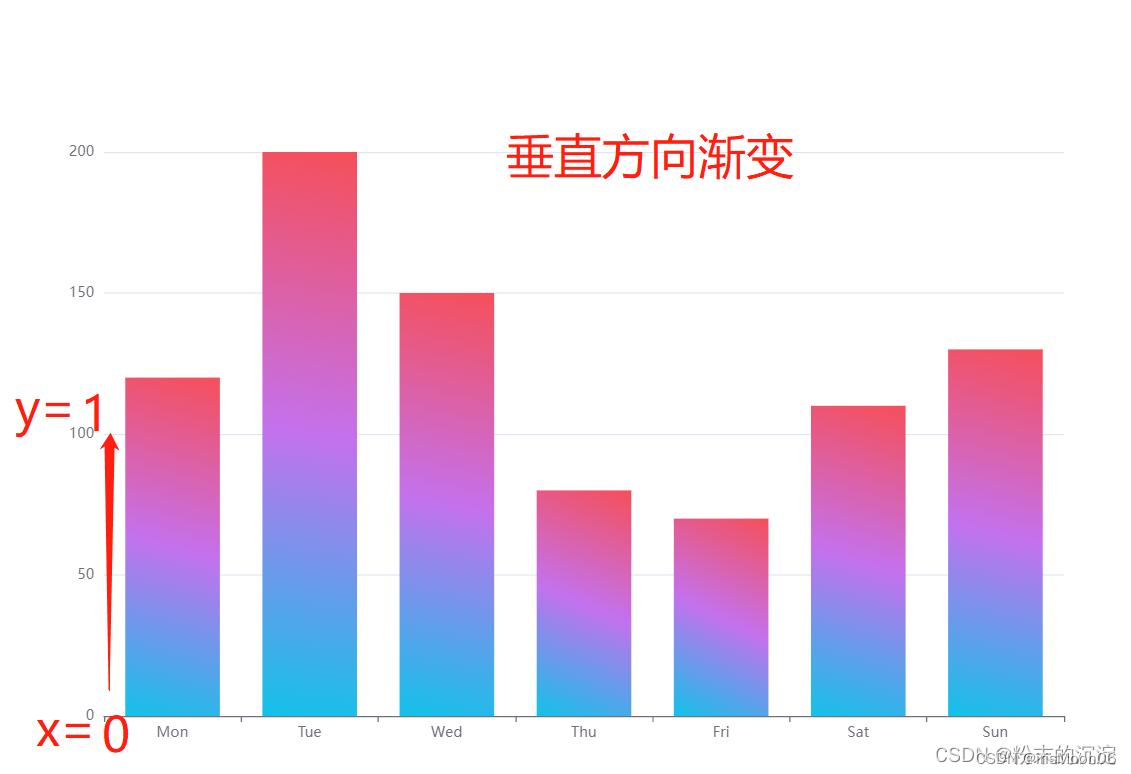
垂直方向的渐变
color: {
								type: 'linear',
								// x=0,y=1,柱子的颜色在垂直方向渐变
								x: 0,
								y: 1,
								colorStops: [
									// 0%处的颜色
									{
										offset: 0,
										color: '#12c2e9',
									},
									// 50%处的颜色
									{
										offset: 0.5,
										color: '#c471ed',
									},
									// 100%处的颜色
									{
										offset: 1,
										color: '#f64f59',
									},
								],
								global: false // 缺省为 false
							}
水平方向的渐变
color: {
								type: 'linear',
								// x2=1,y=0,柱子的颜色在水平方向渐变
								x2: 1,
								y2: 0,
								colorStops: [
									// 0%处的颜色
									{
										offset: 0,
										color: '#12c2e9',
									},
									// 50%处的颜色
									{
										offset: 0.5,
										color: '#c471ed',
									},
									// 100%处的颜色
									{
										offset: 1,
										color: '#f64f59',
									},
								],
								global: false // 缺省为 false
							}
水平方向的渐变
<template>
	<!-- 渐变色案例 -->
	<div id="main" style="width: 100%;height: 600px;"></div>
</template>

<script>
	export default {
		name: "hello",
		props: {
			dataSource: {}
		},
		components: {

		},
		data() {
			return {
				timerId: null,
				myChart: null,
				data:[120, 200, 150, 80, 70, 110, 130],
				option: {
					animation: false,
					xAxis: {
						type: 'category',
						data: ['Mon', 'Tue', 'Wed', 'Thu', 'Fri', 'Sat', 'Sun']
					},
					yAxis: {
						type: 'value'
					},
					series: [
						{
							type: 'bar',
							color: {
								type: 'linear',
								// x2=1,y=0,柱子的颜色在水平方向渐变
								x2: 1,
								y2: 0,
								colorStops: [
									// 0%处的颜色
									{
										offset: 0,
										color: '#12c2e9',
									},
									// 50%处的颜色
									{
										offset: 0.5,
										color: '#c471ed',
									},
									// 100%处的颜色
									{
										offset: 1,
										color: '#f64f59',
									},
								],
								global: false // 缺省为 false
							}
						},
					]
				},
			}
		},
		created() {
		},
		destroyed() {
			this.myChart.dispose();
		},
		mounted() {
			this.initChart();
		},
		methods: {
			initChart() {
				// 设置柱形的值
				this.option.series[0].data = this.data;
				if (this.myChart != null && this.myChart != "" && this.myChart != undefined) {
					this.myChart.dispose();
				}
				this.myChart = this.$echarts.init(document.getElementById('main'));
				this.myChart.setOption(this.option);
			},
		}
	}
</script>

<style scoped>

</style>
径向渐变
<template>
	<!-- 径向渐变色案例 -->
	<div id="main" style="width: 100%;height: 600px;"></div>
</template>

<script>
	export default {
		name: "hello",
		props: {
			dataSource: {}
		},
		components: {

		},
		data() {
			return {
				timerId: null,
				myChart: null,
				data: [120, 200, 150, 80, 70, 110, 130],
				option: {
					animation: false,
					xAxis: {
						type: 'category',
						data: ['Mon', 'Tue', 'Wed', 'Thu', 'Fri', 'Sat', 'Sun']
					},
					yAxis: {
						type: 'value'
					},
					series: [{
						name: '',
						type: 'pictorialBar',
						symbolSize: [50, 50],
						symbolOffset: [-5, -20],
						itemStyle: {
							color: function(params) {
								var colorList = [{
										type: 'radial',
										x: 0.3,
										y: 0.3,
										r: 0.3,
										colorStops: [{
												offset: 0,
												color: '#ffffff',
											},
											{
												offset: 1,
												color: '#eb710f',
											},
										],
										global: false // 缺省为 false
									},
									{
										type: 'radial',
										x: 0.3,
										y: 0.3,
										r: 0.3,
										colorStops: [{
												offset: 0,
												color: '#ffffff',
											},
											{
												offset: 1,
												color: '#01c49a',
											},
										],
										global: false // 缺省为 false
									},
									{
										type: 'radial',
										x: 0.3,
										y: 0.3,
										r: 0.3,
										colorStops: [{
												offset: 0,
												color: '#ffffff',
											},
											{
												offset: 1,
												color: '#2eb0ee',
											},
										],
										global: false // 缺省为 false
									},
									{
										type: 'radial',
										x: 0.3,
										y: 0.3,
										r: 0.3,
										colorStops: [{
												offset: 0,
												color: '#ffffff',
											},
											{
												offset: 1,
												color: '#fd359c',
											},
										],
										global: false // 缺省为 false
									},
									{
										type: 'radial',
										x: 0.3,
										y: 0.3,
										r: 0.3,
										colorStops: [{
												offset: 0,
												color: '#ffffff',
											},
											{
												offset: 1,
												color: '#aa2cbd',
											},
										],
										global: false // 缺省为 false
									},
									{
										type: 'radial',
										x: 0.3,
										y: 0.3,
										r: 0.3,
										colorStops: [{
												offset: 0,
												color: '#ffffff',
											},
											{
												offset: 1,
												color: '#ff5500',
											},
										],
										global: false // 缺省为 false
									},
									{
										type: 'radial',
										x: 0.3,
										y: 0.3,
										r: 0.3,
										colorStops: [{
												offset: 0,
												color: '#ffffff',
											},
											{
												offset: 1,
												color: '#0000ff',
											},
										],
										global: false // 缺省为 false
									},
								];
								return colorList[params.dataIndex];
							},
						},
						symbolPosition: 'end',
					}]
				},
			}
		},
		created() {},
		destroyed() {
			this.myChart.dispose();
		},
		mounted() {
			this.initChart();
		},
		methods: {
			initChart() {
				// 设置柱形的值
				this.option.series[0].data = this.data;
				if (this.myChart != null && this.myChart != "" && this.myChart != undefined) {
					this.myChart.dispose();
				}
				this.myChart = this.$echarts.init(document.getElementById('main'));
				this.myChart.setOption(this.option);
			},
		}
	}
</script>

<style scoped>

</style>