MATLAB在学习生活中应用非常广,简单总结一点MATLAB的使用小技巧,在脚本中自定义函数表达式并进行绘制
主要包括:
- 线性: f(x)=ax+b
- 二次:f(x)=ax^2+bx+c
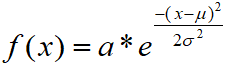
- 高斯函数:
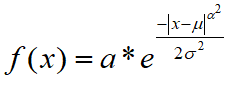
- 广义高斯函数:
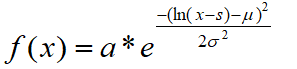
- 对数正态函数:
代码实现的主要思路为:
- 使用了syms函数来定义变量
- 自定义函数表达式
- 定义自变量x的取值范围
- 使用subs函数把x的值代入自定义好的表达式中,求解出因变量的值
- 使用plot函数绘制自定义函数的曲线
绘制曲线图为:
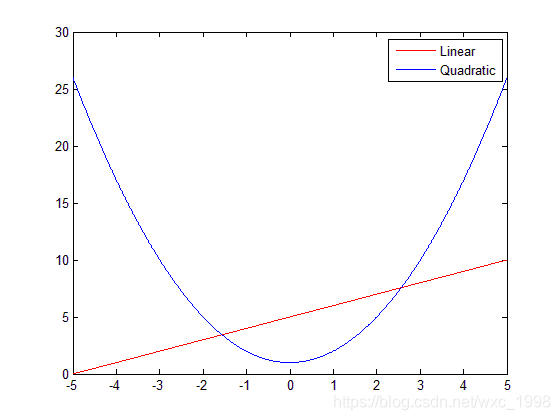
线性函数和二次函数:
函数表达式为:fx1 = x + 5 以及 fx2 = x^2 + 1
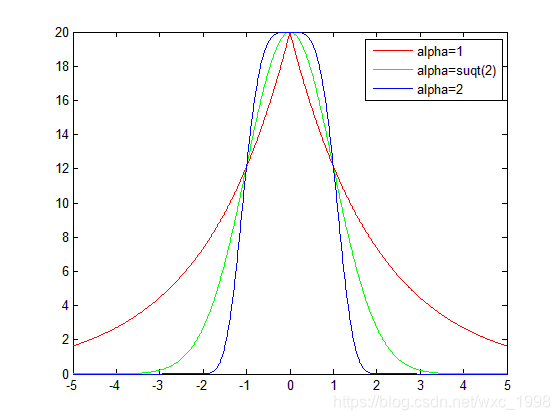
高斯函数与广义高斯函数:
注意:alpha的取值决定了函数顶部的尖锐程度,当alpha<sqrt(2)时曲线很窄;alpha=sqrt(2)时为标准的高斯函数;alpha>sqrt(2)时,曲线的顶部变宽。
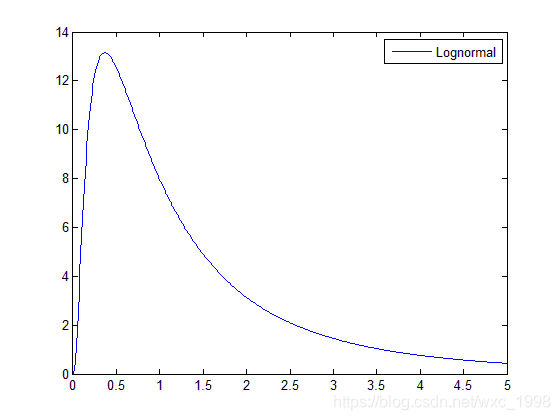
对数正态函数:
源代码如下(若格式乱了也可以通过:此链接下载相关文件):
%% xiaochen wang 2020/07/11
% plot function curve
% such as:
% linear:f(x)=ax+b
% quadratic:f(x)=ax^2+bx+c
% gaussian function:f(x)=a*exp(-(x-μ)^2/2σ^2)
% generalized gaussian function:f(x)=a*exp(-|x-μ|^α^2/2σ^2)
% lognormal function:f(x)=a*exp(-(ln(x-s)-μ)^2/2σ^2)

clc;
clear all;

syms x fx1 fx2 fx3 fx4_1 fx4_2 fx5; % creating symbolic variables or function

a = 20; miu = 0; xigma = 1; % define the parameters of gaussian function, A,μ,σ
alpha = sqrt(4); % define the value of parameter α (generalized gaussian function)
s = 1; % define the value of parameter s (lognormal function)

fx1 = x + 5; % linear
fx2 = x^2 + 1; % quadratic
fx3 = a*exp(-(x-miu)^2/(2*xigma^2)); % gaussian
fx4_1 = a*exp(-abs(x-miu)^(alpha^2)/(2*xigma^2)); % generalized gaussian
alpha = sqrt(1); % modify the value of alpha
fx4_2 = a*exp(-abs(x-miu)^(alpha^2)/(2*xigma^2)); % generalized gaussian
fx5 = a*(1/(x*xigma*sqrt(2*pi)))*exp(-(log(x)-miu)^2/(2*xigma^2)); %1/x*xigma*sqrt(2*pi)

xx = -5:0.01:5; %variables x
xx2 = 0.01:0.01:5; %variables x in lognormal function must greater than zero
ans1 = subs(fx1, x, xx);
ans2 = subs(fx2, x, xx);
ans3 = subs(fx3, x, xx);
ans4_1 = subs(fx4_1, x, xx);
ans4_2 = subs(fx4_2, x, xx);
ans5 = subs(fx5, x, xx2);

figure('Name', 'Linear_and_Quadratic');
plot(xx, ans1, 'r'); % plot linear function
hold on;
plot(xx, ans2, 'b'); % plot quadratic function
legend('Linear', 'Quadratic');

figure('Name', 'Gaussian_and_Generalized gaussian');
plot(xx, ans4_2, 'r'); % alpha = 1
hold on;
plot(xx, ans3, 'g'); % alpha = sqrt(2)
hold on;
plot(xx, ans4_1, 'b'); % alpha = 2
legend('alpha=1', 'alpha=suqt(2)', 'alpha=2')

figure('Name', 'Lognormal');
plot(xx2, ans5);
legend('Lognormal');