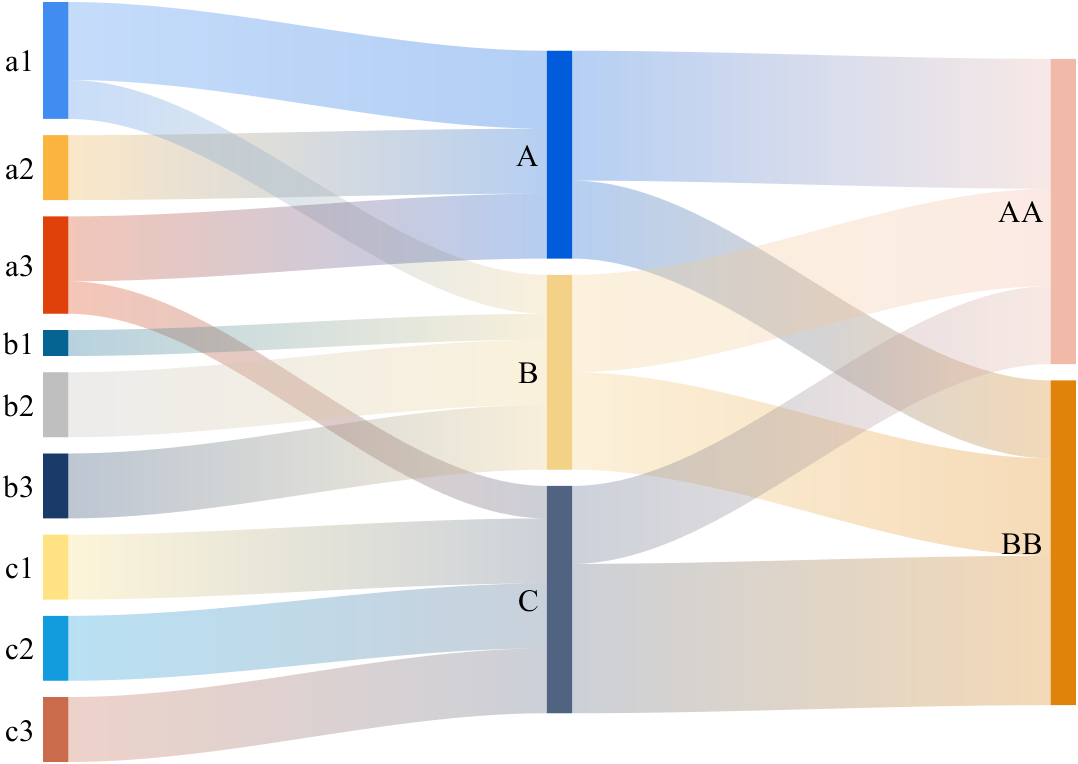
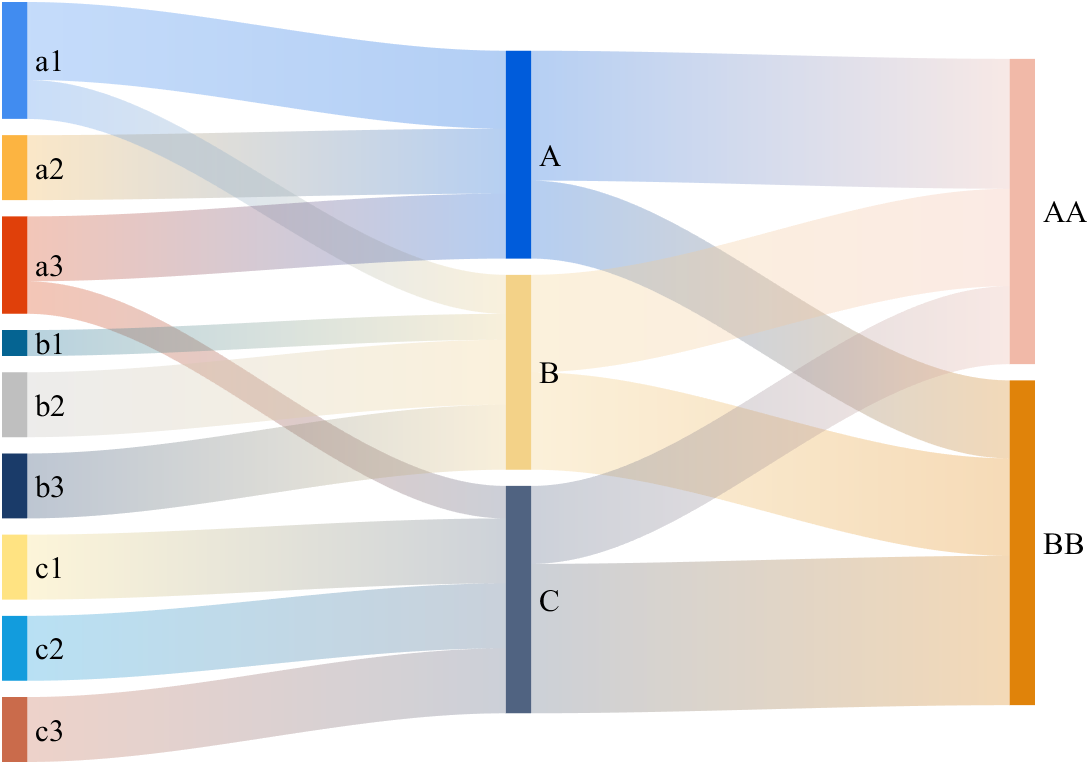
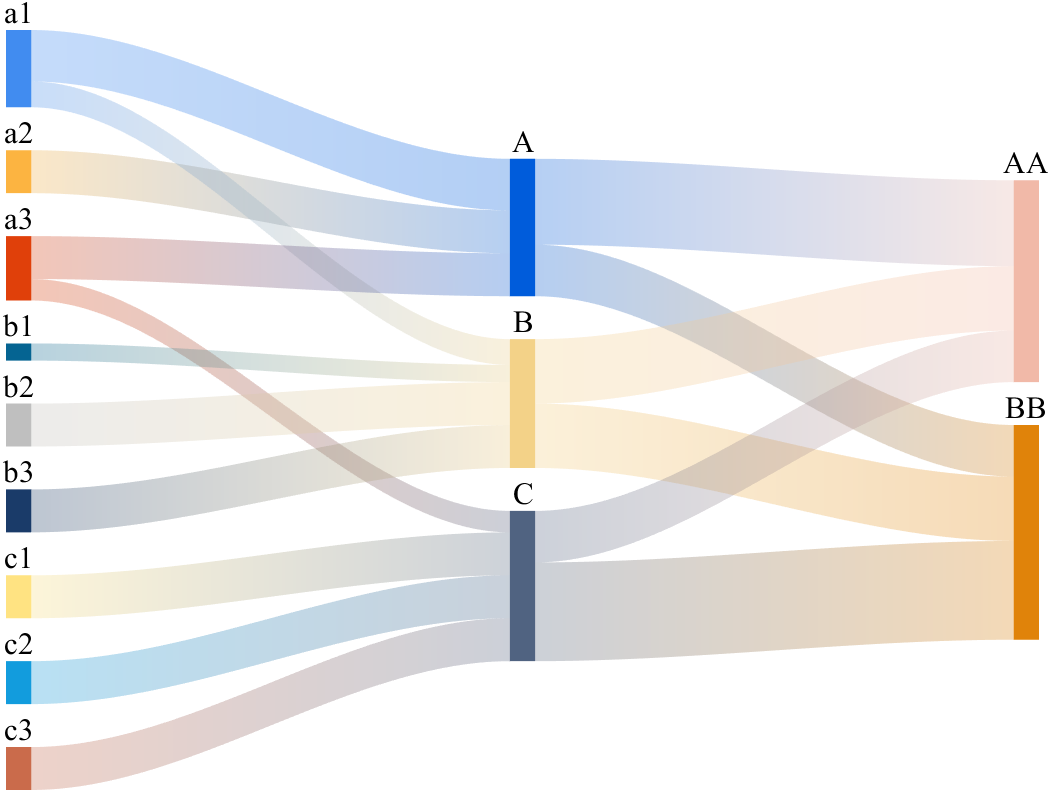
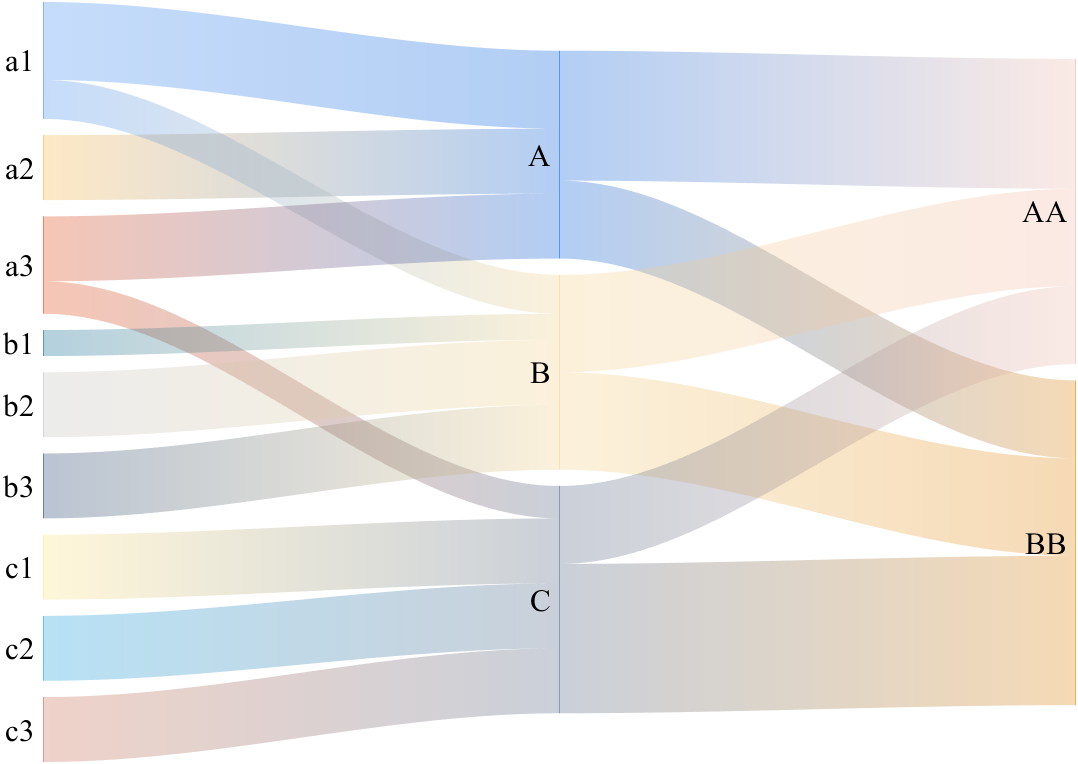
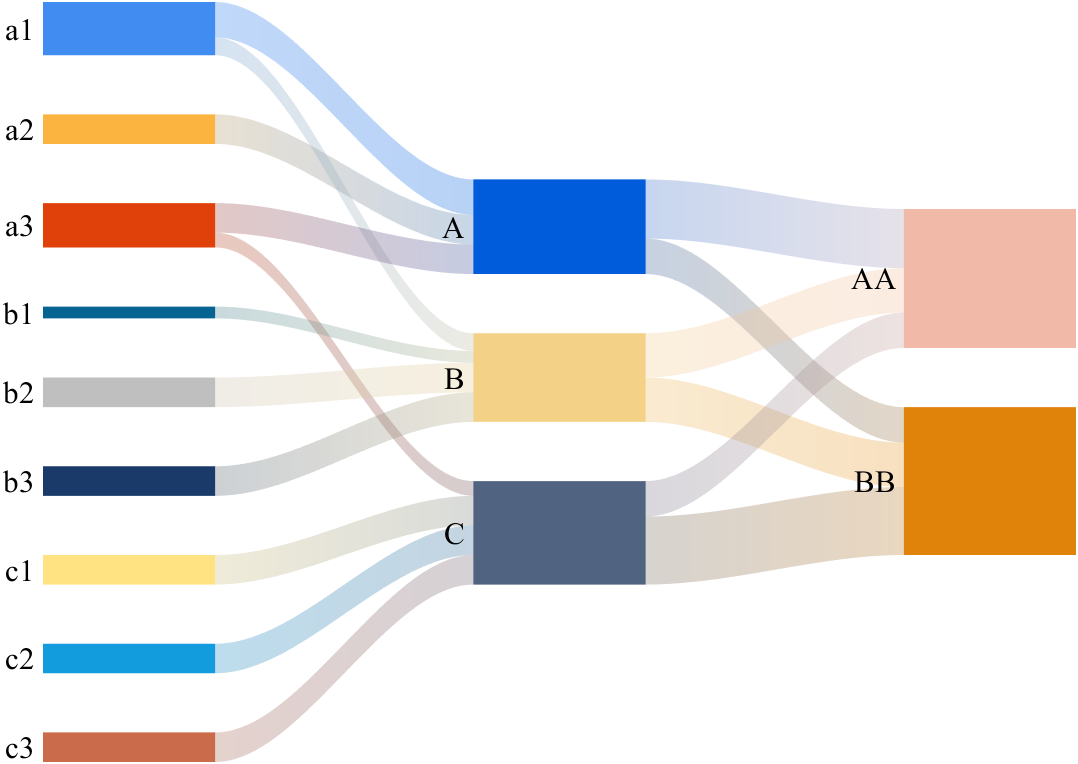
我之前也出过一个超简单的桑基图绘制函数,但是无法应对很多特殊情况,在这里我将其重构了一些写成了类,加了很多内置修饰函数,实现了流入流出数据不相等或者跨层数据流动的特殊情况绘制,首先展示一下使用我编写的函数能够实现怎样的效果吧:


以上的图片全是本文的示例,照旧先讲解咋用,工具函数放在文末吧!!!
用法介绍
0 数据输入
数据输入要求三列元胞数组,分别代表Source流向的起点,Target流向的终点及,Value就是流动的数据量:
links={

    'a1','A',1.2;
       'a2','A',1;
       'a1','B',.6;
       'a3','A',1;
       'a3','C',.5;
       'b1','B',.4;
       'b2','B',1;
       'b3','B',1;
       'c1','C',1;
       'c2','C',1;
       'c3','C',1;
       'A','AA',2;
       'A','BB',1.2;
       'B','BB',1.5;
       'B','AA',1.5;
       'C','BB',2.3;
       'C','AA',1.2};
1 基本绘制
其实主要就两行即可绘制:
links={

    'a1','A',1.2;'a2','A',1;'a1','B',.6;'a3','A',1; 'a3','C',0.5;
       'b1','B',.4; 'b2','B',1;'b3','B',1; 'c1','C',1;
       'c2','C',1;  'c3','C',1;'A','AA',2; 'A','BB',1.2;
       'B','BB',1.5; 'B','AA',1.5; 'C','BB',2.3; 'C','AA',1.2};

% 创建桑基图对象(Create a Sankey diagram object)
SK=SSankey(links(:,1),links(:,2),links(:,3));

% 开始绘图(Start drawing)
SK.draw()

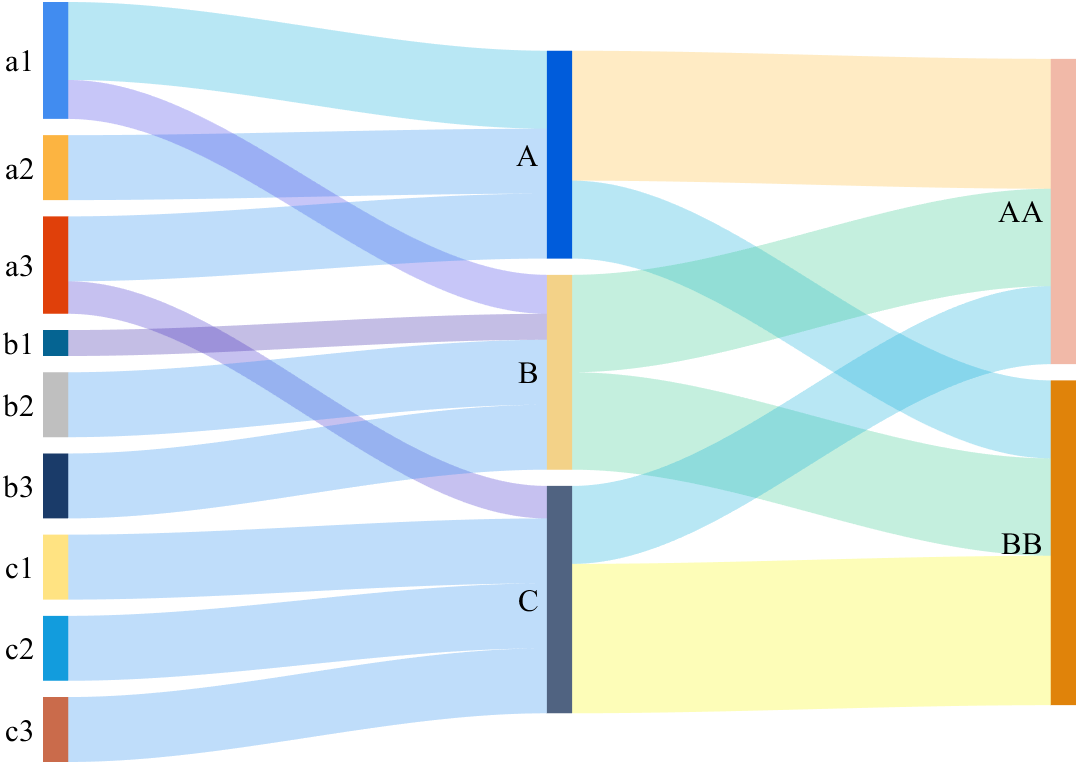
2 连接渲染方式
连接渲染方式有:
- ‘left’
- ‘right’
- ‘interp’(default)
- ‘map’
- ‘simple’
几种其中渐变渲染interp是默认渲染方式,修改渲染方式可以通过在draw之前设置RenderingMethod属性进行,例如(还是之前的数据):
% 创建桑基图对象(Create a Sankey diagram object)
SK=SSankey(links(:,1),links(:,2),links(:,3));

% 修改链接颜色渲染方式(Set link color rendering method)
% 'left'/'right'/'interp'(default)/'map'/'simple'
SK.RenderingMethod='left';

% 开始绘图(Start drawing)
SK.draw()
left
即连接颜色与左侧节点方块相同:

right
interp

map
即依据Value大小进行上色,可通过colormap函数改颜色条。
simple
纯灰色:

3 方块对齐方式
就是分别’up’/‘down’/‘center’(default)设置上对齐、下对齐、居中,通过设置Align进行配置,依旧需要draw之前设置:
% 创建桑基图对象(Create a Sankey diagram object)
SK=SSankey(links(:,1),links(:,2),links(:,3));

% 修改对齐方式(Set alignment)
% 'up'/'down'/'center'(default)
SK.Align='up';

% 开始绘图(Start drawing)
SK.draw()
up

down

center

4 文本位置
文本位置无非就是上下左右居中:‘left’(default)/‘right’/‘top’/‘center’/‘bottom’,通过LabelLocation属性进行设置:
% 创建桑基图对象(Create a Sankey diagram object)
SK=SSankey(links(:,1),links(:,2),links(:,3));

% 修改文本位置(Set Text Location)
% 'left'(default)/'right'/'top'/'center'/'bottom'
SK.LabelLocation='top';

SK.Sep=.2;

% 开始绘图(Start drawing)
SK.draw()
注意位置设置到top及down时,为了避免遮挡可以设置Sep调整方块间空隙占比:
left
right
top
center

bottom

5 间隙与占比
方块横向宽度占比可以通过设置BlockScale属性设置要大于0小于1,越大方块占比越大。
% 创建桑基图对象(Create a Sankey diagram object)
SK=SSankey(links(:,1),links(:,2),links(:,3));

% 设置方块占比(Set the scale of blocks)
% BlockScale>0 & BlockScale<1
SK.BlockScale=.4;

% 开始绘图(Start drawing)
SK.draw()

如果调成.001:
同时调一下上下空隙占比:
% 设置缝隙占比(Separation distance proportion)
SK.Sep=.4;
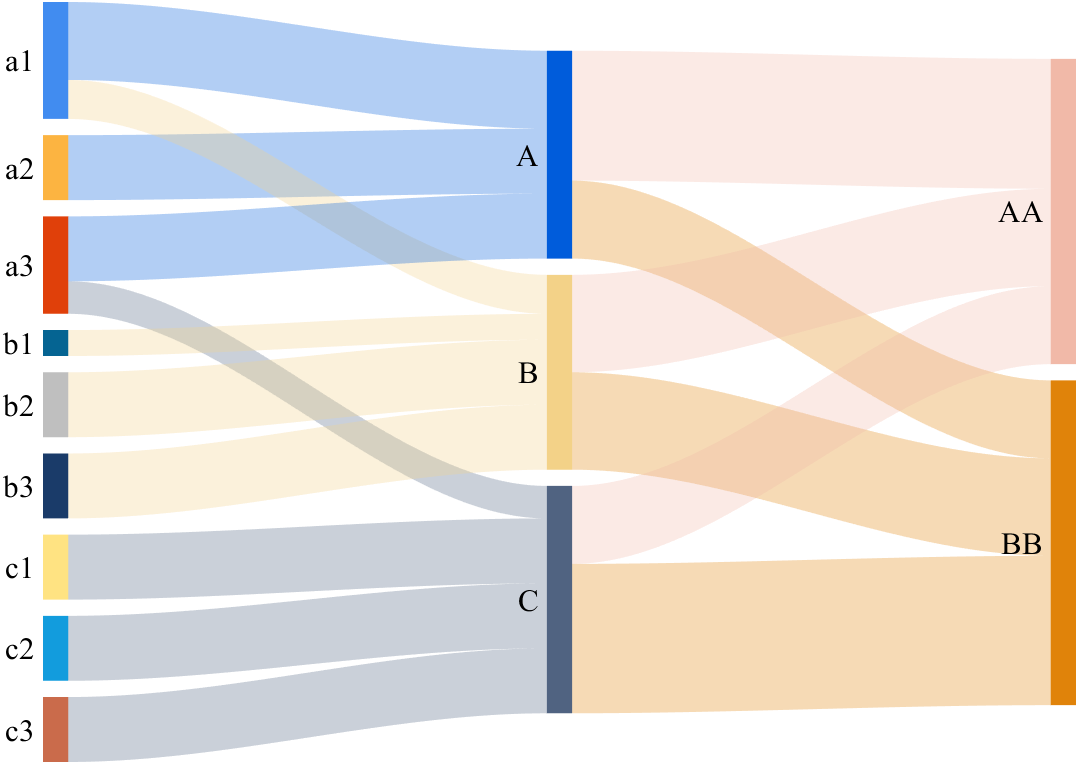
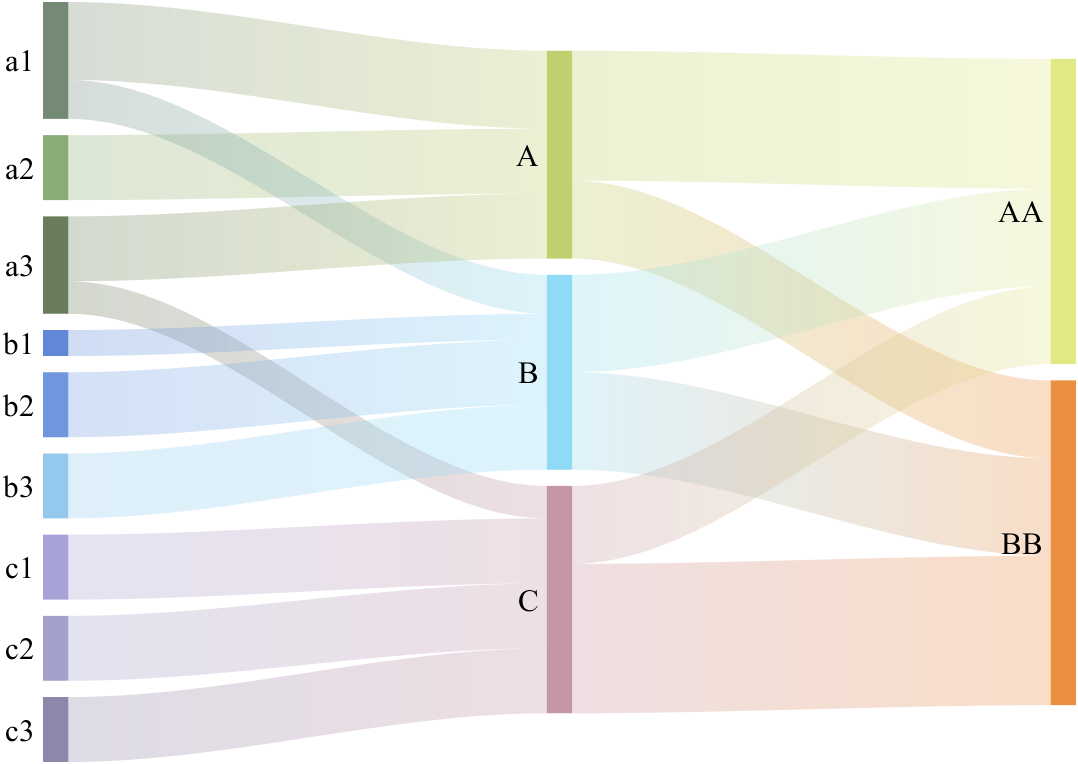
6 配色设置
通过设置ColorList属性更改预设配色:
% 创建桑基图对象(Create a Sankey diagram object)
SK=SSankey(links(:,1),links(:,2),links(:,3));

% 设置颜色(Set color)
SK.ColorList=[0.46, 0.54, 0.46;
    0.54, 0.68, 0.46;
    0.41, 0.49, 0.36;
    0.38, 0.53, 0.84;
    0.44, 0.59, 0.87;
    0.58, 0.79, 0.93;
    0.65, 0.64, 0.84;
    0.63, 0.63, 0.80;
    0.56, 0.53, 0.67;
    0.76, 0.81, 0.43;
    0.56, 0.86, 0.97;
    0.78, 0.59, 0.65;
    0.89, 0.91, 0.53;
    0.93, 0.56, 0.25;];

% 开始绘图(Start drawing)
SK.draw()
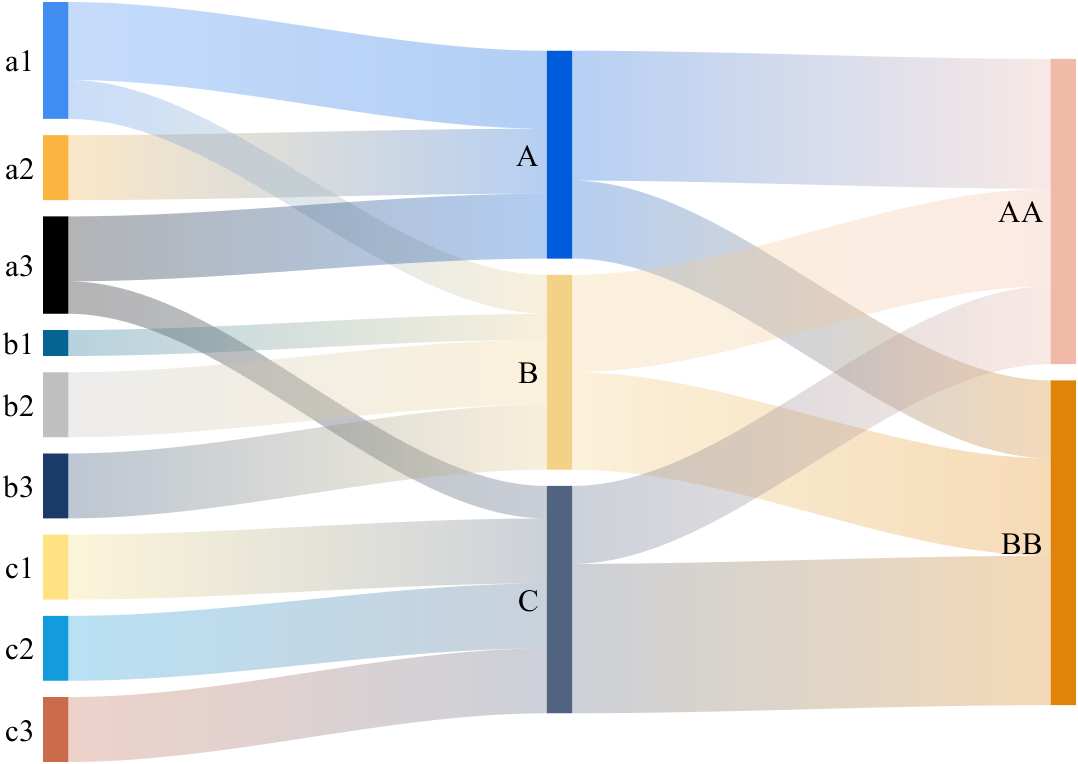
当然可以只改部分配色(比如把a3改为黑色):
links={

    'a1','A',1.2;'a2','A',1;'a1','B',.6;'a3','A',1; 'a3','C',0.5;
       'b1','B',.4; 'b2','B',1;'b3','B',1; 'c1','C',1;
       'c2','C',1;  'c3','C',1;'A','AA',2; 'A','BB',1.2;
       'B','BB',1.5; 'B','AA',1.5; 'C','BB',2.3; 'C','AA',1.2};

% 创建桑基图对象(Create a Sankey diagram object)
SK=SSankey(links(:,1),links(:,2),links(:,3));

% 设置颜色(Set color)
SK.ColorList(3,:)=[0,0,0];

% 开始绘图(Start drawing)
SK.draw()
7 流入及流出数据不相等
流入及流出数据不相等这样特殊的图也能画啦,原本的数据把C到BB数据改小成0.5 (links{16,3}=.5):
% 流入及流出数据不相等(Unequal inflow and outflow data)
links={

    'a1','A',1.2;'a2','A',1;'a1','B',.6;'a3','A',1; 'a3','C',0.5;
       'b1','B',.4; 'b2','B',1;'b3','B',1; 'c1','C',1;
       'c2','C',1;  'c3','C',1;'A','AA',2; 'A','BB',1.2;
       'B','BB',1.5; 'B','AA',1.5; 'C','BB',2.3; 'C','AA',1.2};
links{

    16,3}=.5;

% 创建桑基图对象(Create a Sankey diagram object)
SK=SSankey(links(:,1),links(:,2),links(:,3));

% 开始绘图(Start drawing)
SK.draw();

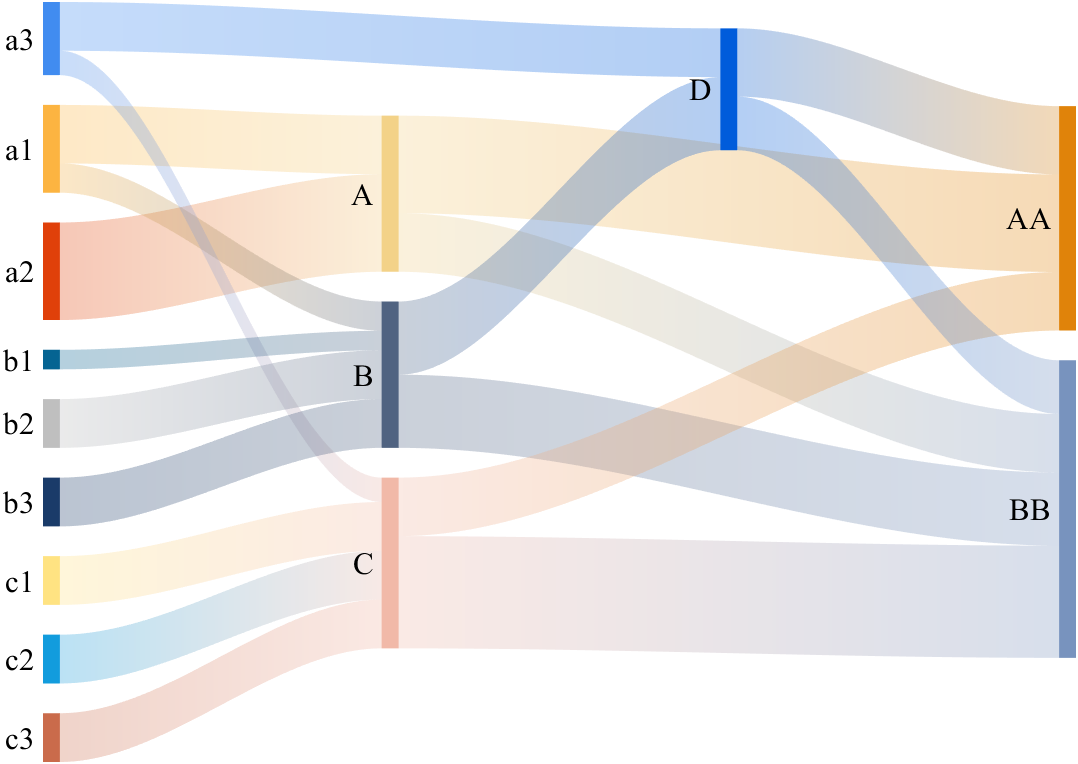
8 跨层级流动
% 含跨层级流动(Including cross level flow)
links={

    'a1','A',1.2;'a2','A',2;'a1','B',.6;'a3','D',1; 'a3','C',0.5;
       'b1','B',.4; 'b2','B',1;'b3','B',1; 'c1','C',1;
       'c2','C',1;  'c3','C',1;'A','AA',2; 'A','BB',1.2;
       'B','BB',1.5; 'B','D',1.5; 'C','BB',2.3; 'C','AA',1.2;
       'D','AA',1.4; 'D','BB',1.1};

% 创建桑基图对象(Create a Sankey diagram object)
SK=SSankey(links(:,1),links(:,2),links(:,3));

SK.Sep=.1;

% 开始绘图(Start drawing)
SK.draw()

这样直接画会有遮挡,还会有比较别扭的连接次序(下面的连接往上面连,上面的连接往下面连)
默认的连接次序是
unique([Source;Target],'stable')
这样计算的,当然这个属性可以自己设置,我们先调整连接的总顺序:
% 创建桑基图对象(Create a Sankey diagram object)
SK=SSankey(links(:,1),links(:,2),links(:,3));

% 修改节点排列次序(Modify node arrangement order)
SK.NodeList={

    'a3','a1','a2','b1','b2','b3','c1','c2','c3','D','A','B','C','AA','BB'};

SK.Sep=.1;

% 开始绘图(Start drawing)
SK.draw()

顺眼多了,但是放在最中间还是挡着,我们想将其往上移动,可以使用moveBlockY函数,这里D节点是第10个节点,我们将其向上移动6个单位值(若是Value都很大就多移动点),注意因为要移动的是已经画好的东西,所以移动的操作要放在draw操作后:
% 含跨层级流动(Including cross level flow)
links={

    'a1','A',1.2;'a2','A',2;'a1','B',.6;'a3','D',1; 'a3','C',0.5;
       'b1','B',.4; 'b2','B',1;'b3','B',1; 'c1','C',1;
       'c2','C',1;  'c3','C',1;'A','AA',2; 'A','BB',1.2;
       'B','BB',1.5; 'B','D',1.5; 'C','BB',2.3; 'C','AA',1.2;
       'D','AA',1.4; 'D','BB',1.1};

% 创建桑基图对象(Create a Sankey diagram object)
SK=SSankey(links(:,1),links(:,2),links(:,3));

% 修改节点排列次序(Modify node arrangement order)
SK.NodeList={

    'a3','a1','a2','b1','b2','b3','c1','c2','c3','D','A','B','C','AA','BB'};

SK.Sep=.1;

% 开始绘图(Start drawing)
SK.draw()

% 修改节点Y轴位置变化(Modify the position change of node Y direction)
SK.moveBlockY(10,+6);
9 已绘制完成图形修饰
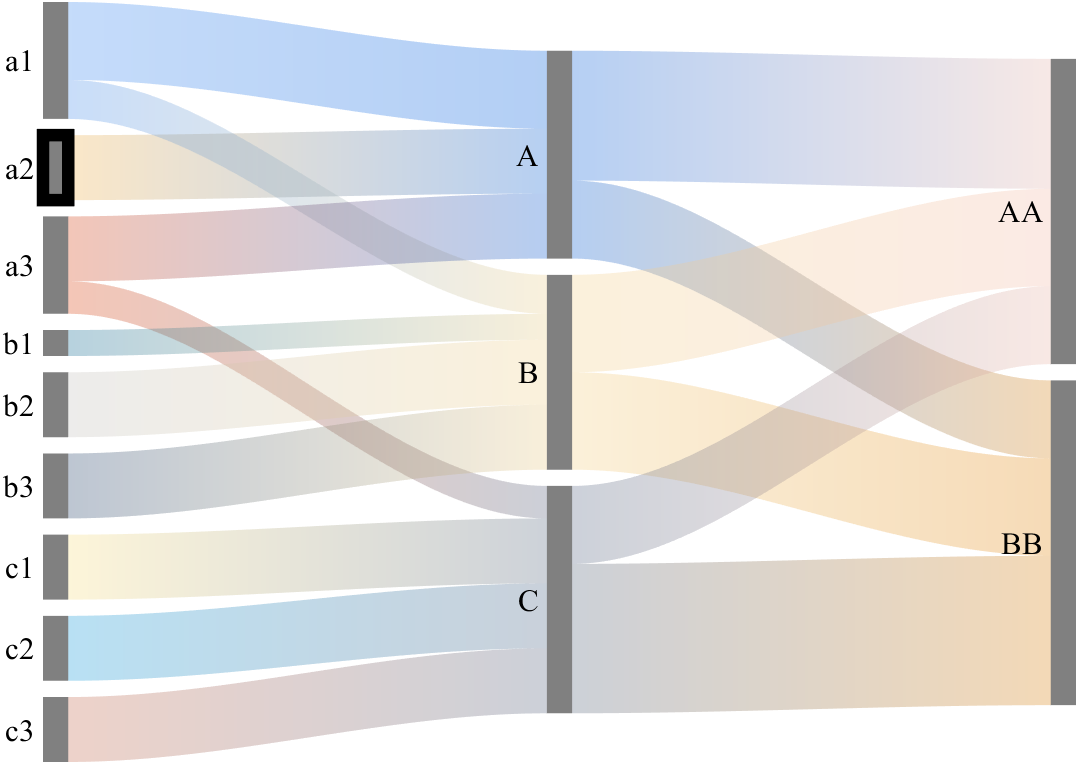
修饰方块就用setBlock(n,prop,…)的形式,例如(将2号方块加黑色粗轮廓线):
因为要修饰的是已经画好的东西,所以修饰的操作要放在draw操作后:
links={

    'a1','A',1.2;'a2','A',1;'a1','B',.6;'a3','A',1; 'a3','C',0.5;
       'b1','B',.4; 'b2','B',1;'b3','B',1; 'c1','C',1;
       'c2','C',1;  'c3','C',1;'A','AA',2; 'A','BB',1.2;
       'B','BB',1.5; 'B','AA',1.5; 'C','BB',2.3; 'C','AA',1.2};

% 创建桑基图对象(Create a Sankey diagram object)
SK=SSankey(links(:,1),links(:,2),links(:,3));

% 开始绘图(Start drawing)
SK.draw()

% 设置方块属性(Set Block Properties)
SK.setBlock(2,'EdgeColor',[0,0,0],'LineWidth',6)

循环都修饰一下(全设置为灰色):
% 循环设置方块属性(Loop Set Block Properties)
for i=1:14
    SK.setBlock(i,'FaceColor',[.5,.5,.5])
end
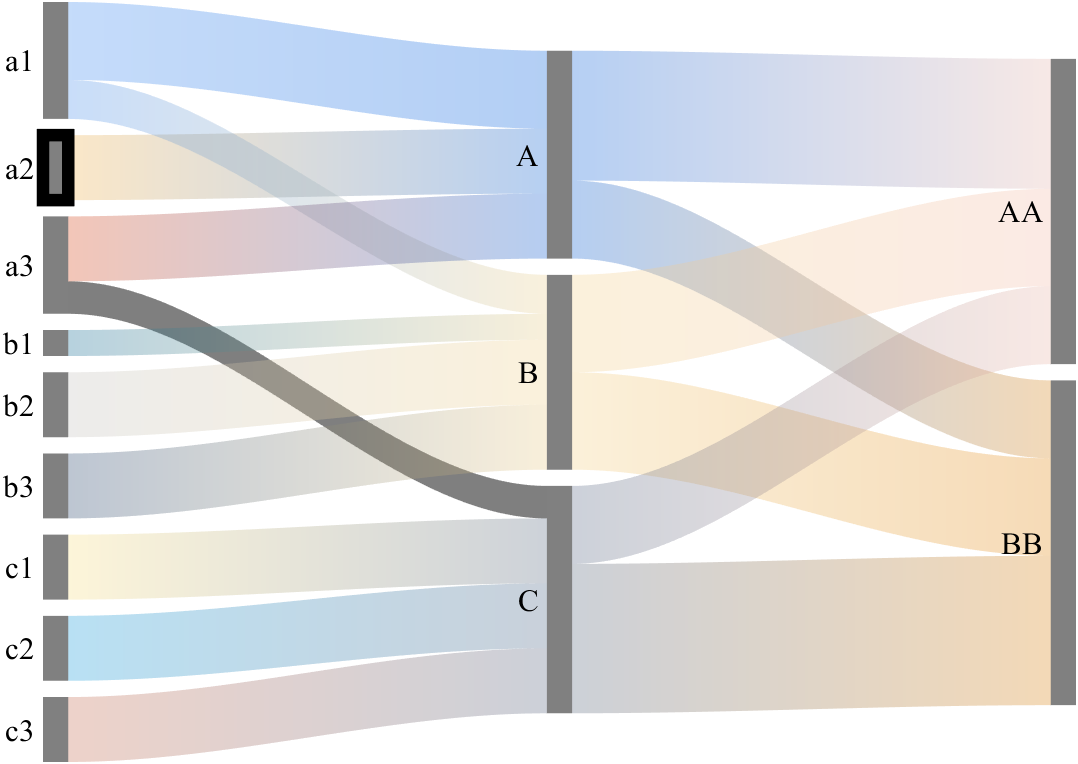
设置连接弦就使用setLink(n,prop,…)
% 设置连接属性(Set Link Properties)
SK.setLink(5,'FaceColor',[0,0,0],'FaceAlpha',.5)
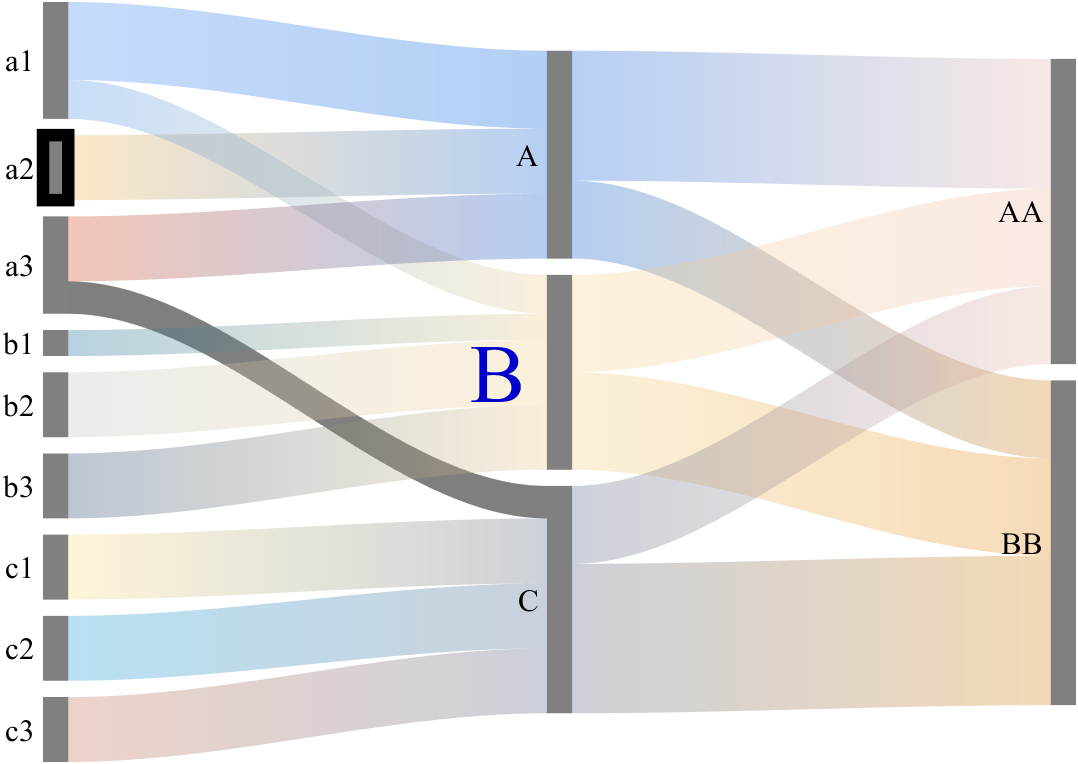
设置文本setLabel(n,prop,…)
% 设置标签属性(Set Label Properties)
SK.setLabel(11,'FontSize',40,'Color',[0,0,.8])
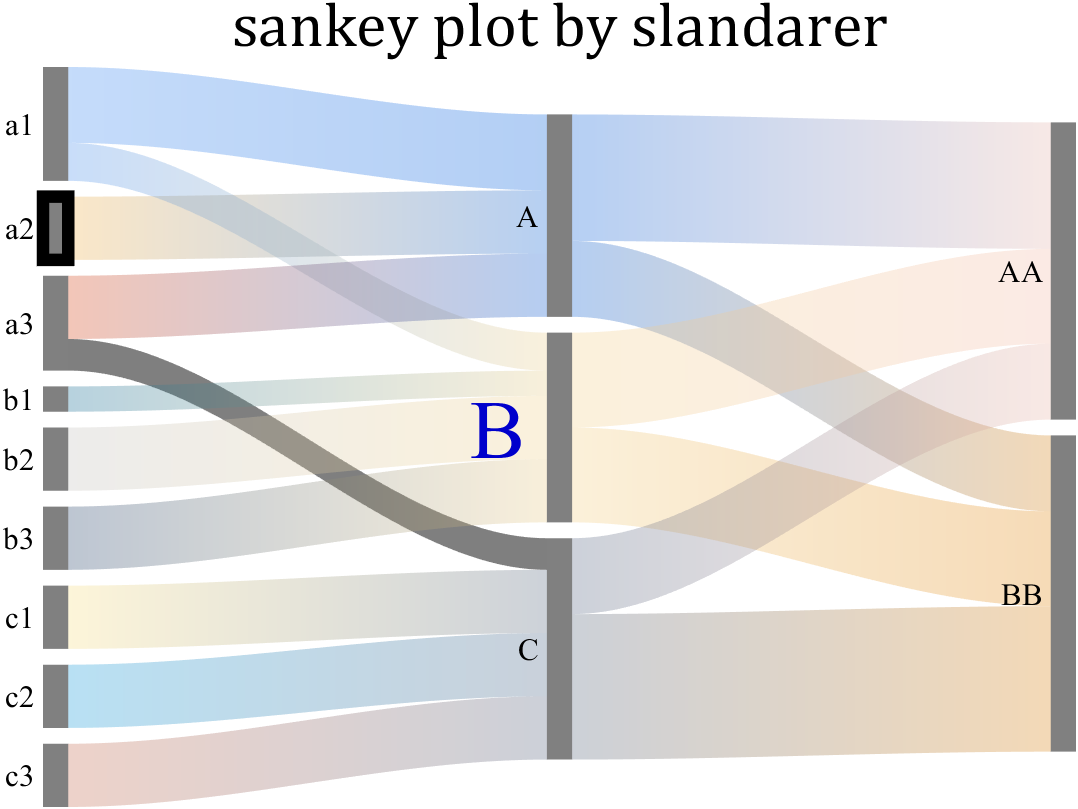
顺嘴一提,添加标题还是title函数就可以:
title(gca,'sankey plot by slandarer','FontSize',30,'FontName','Cambria')
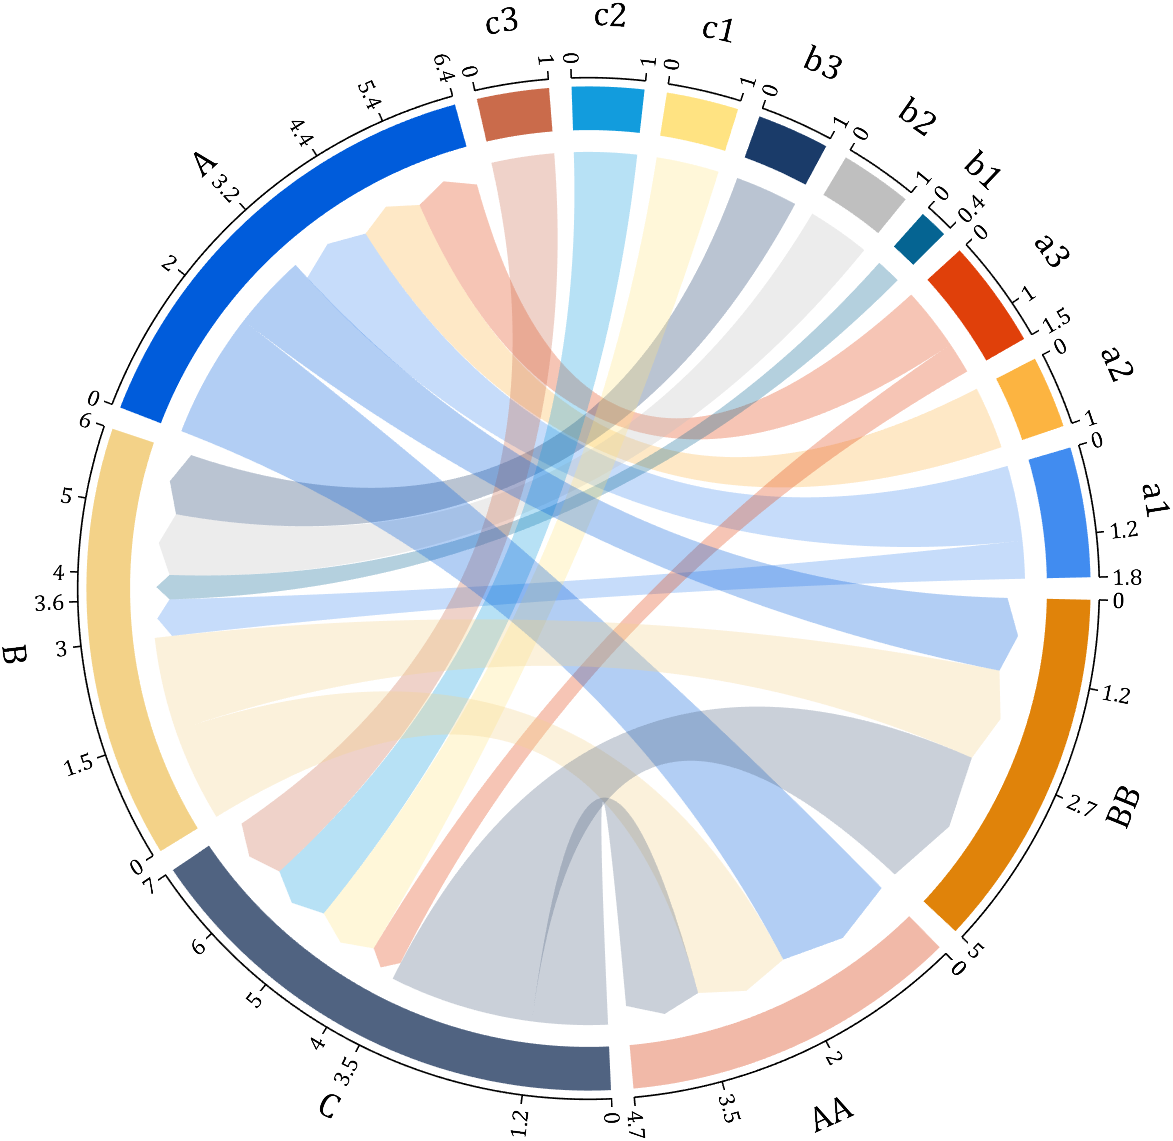
10 环形桑基图
本文函数可以和我写的有向弦图函数联动搞出环形桑基图,有向弦图的函数biChordChart可在fileexchange或者gitee仓库获取,篇幅问题不再赘述:
biChordChart 有向弦图 fileexchange
Zhaoxu Liu / slandarer (2023). Digraph chord chart 有向弦图 (https://www.mathworks.com/matlabcentral/fileexchange/121043-digraph-chord-chart), MATLAB Central File Exchange. 检索来源 2023/4/1.
gitee仓库
https://gitee.com/slandarer/matlab-chord-chart
未经许可代码不能做任何商务用途,引用可以引用上述fileexchange链接,引用时可以可改变引用文本格式,但至少应包含链接。
联动使用代码
links={

    'a1','A',1.2;'a2','A',1;'a1','B',.6;'a3','A',1; 'a3','C',0.5;
       'b1','B',.4; 'b2','B',1;'b3','B',1; 'c1','C',1;
       'c2','C',1;  'c3','C',1;'A','AA',2; 'A','BB',1.2;
       'B','BB',1.5; 'B','AA',1.5; 'C','BB',2.3; 'C','AA',1.2};

% 创建桑基图对象(Create a Sankey diagram object)
SK=SSankey(links(:,1),links(:,2),links(:,3));
SK.draw();close all

figure('Name','sankey demo6','Units','normalized','Position',[.05,.05,.59,.8])
BCC=biChordChart(SK.AdjMat,'Arrow','on','Label',SK.NodeList);
BCC.CData=[[65,140,240;252,180,65;224,64,10;5,100,146;191,191,191;26,59,105;255,227,130;18,156,221;
    202,107,75;0,92,219;243,210,136;80,99,129;241,185,168;224,131,10;120,147,190]./255;
    [127,91,93;187,128,110;197,173,143;59,71,111;104,95,126;76,103,86;112,112,124;
    72,39,24;197,119,106;160,126,88;238,208,146]./255];
BCC=BCC.draw();

% 添加刻度
BCC.tickState('on')
BCC.tickLabelState('on')

BCC.setTickFont('FontName','Cambria','FontSize',11)
BCC.setFont('FontName','Cambria','FontSize',17)

BCC.setLabelRadius(1.32);

11 附加小案例(一)
需要注意的是这里节点是中文,务必设置字体为支持中文的字体,例如宋体。
clc;clear;
links{

    7,3}='';
for i=1:7
    links{

    i,1}=['浏览',num2str(i)];
    links{

    i,2}=['浏览',num2str(i+1)];
    links{

    i,3}=10000-1400*i;
end
for i=1:7
    links{

    i+7,1}=['浏览',num2str(i)];
    links{

    i+7,2}=['下载',num2str(i)];
    links{

    i+7,3}=900;
end
for i=1:7
    links{

    i+14,1}=['浏览',num2str(i)];
    links{

    i+14,2}=['流失',num2str(i)];
    links{

    i+14,3}=500;
    if i>=3
        links{

    i+14,3}=1100;
    end
end
for i=1:6
    links{

    i+21,1}=['下载',num2str(i)];
    links{

    i+21,2}=['浏览',num2str(i+2)];
    links{

    i+21,3}=600;
end
for i=1:6
    links{

    i+27,1}=['下载',num2str(i)];
    links{

    i+27,2}=['流失',num2str(i+1)];
    links{

    i+27,3}=300;
end

% 创建桑基图对象(Create a Sankey diagram object)
SK=SSankey(links(:,1),links(:,2),links(:,3));

SK.NodeList={

    '浏览1','浏览2','浏览3','浏览4','浏览5','浏览6','浏览7','浏览8',...
             '下载1','下载2','下载3','下载4','下载5','下载6','下载7',...
             '流失1','流失2','流失3','流失4','流失5','流失6','流失7'};
SK.ColorList=[197,141,91;69,168,134;114,191,220;193,135,146;242,132,98;249,190,89;207,202,100;171,203,110;
              repmat([114,158,158],[7,1]);repmat([100,136,177],[7,1])]./255;

% 修改对齐方式(Set alignment)
% 'up'/'down'/'center'(default)
SK.Align='down';

% 修改链接颜色渲染方式(Set link color rendering method)
% 'left'/'right'/'interp'(default)/'map'/'simple'
SK.RenderingMethod='left';

% 修改文本位置(Set Text Location)
% 'left'(default)/'right'/'top'/'center'/'bottom'
SK.LabelLocation='right';

% 设置方块占比(Set the scale of blocks)
% BlockScale>0 & BlockScale<1
SK.BlockScale=.16;

% 开始绘图(Start drawing)
SK.draw()

% 循环设置标签属性(Loop Set Label Properties)
for i=1:22
    SK.setLabel(i,'FontName','宋体','FontSize',12)
end

for i=10:15
    SK.moveBlockY(i,(9-i).*1000);
end
for i=17:22
    SK.moveBlockY(i,(16-i).*1000);
end
三种对齐方式的效果:

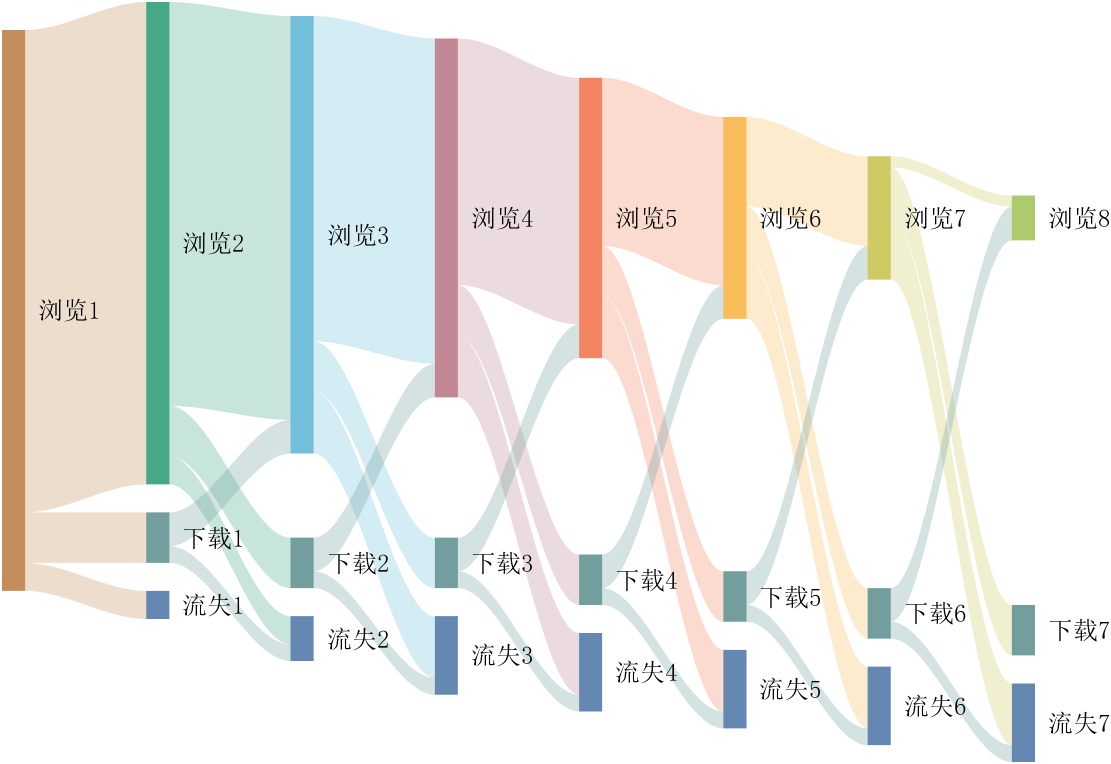
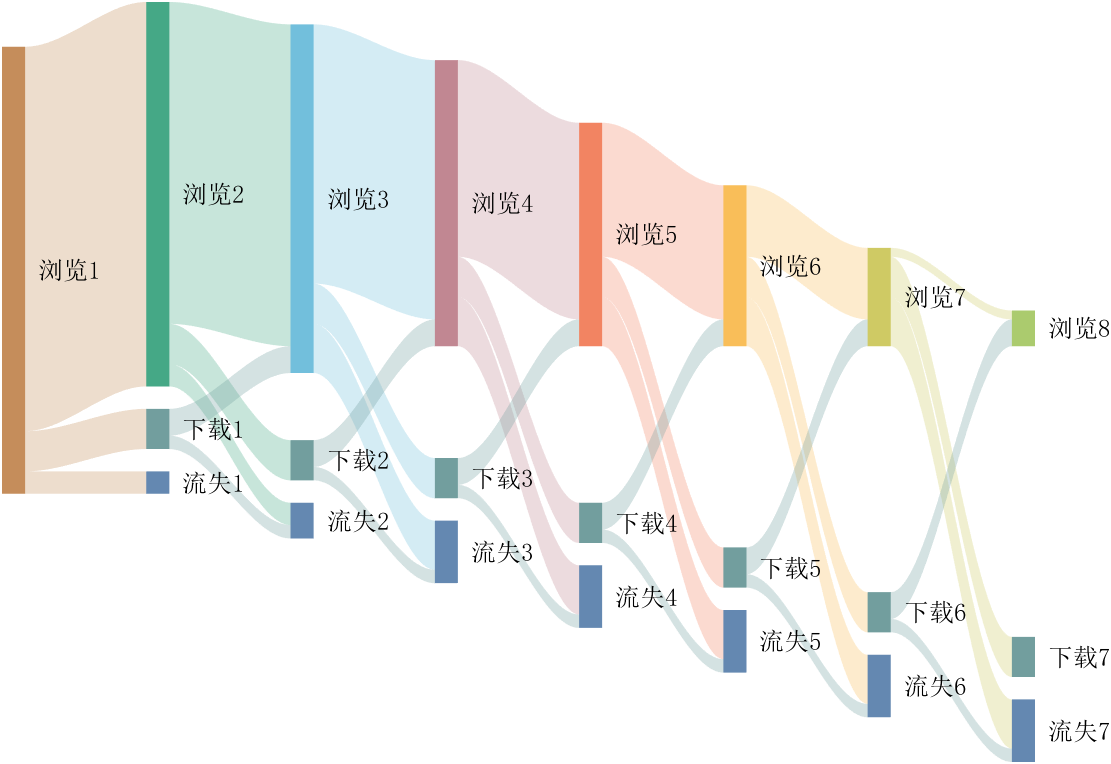
实际上不进行任何额外参数调整的基础版也挺好看的:
% 创建桑基图对象(Create a Sankey diagram object)
SK=SSankey(links(:,1),links(:,2),links(:,3));

SK.NodeList={

    '浏览1','浏览2','浏览3','浏览4','浏览5','浏览6','浏览7','浏览8',...
             '下载1','下载2','下载3','下载4','下载5','下载6','下载7',...
             '流失1','流失2','流失3','流失4','流失5','流失6','流失7'};

% 修改对齐方式(Set alignment)
% 'up'/'down'/'center'(default)
SK.Align='top';

% 修改链接颜色渲染方式(Set link color rendering method)
% 'left'/'right'/'interp'(default)/'map'/'simple'
SK.RenderingMethod='left';

% 修改文本位置(Set Text Location)
% 'left'(default)/'right'/'top'/'center'/'bottom'
SK.LabelLocation='right';

% 开始绘图(Start drawing)
SK.draw()

% 循环设置标签属性(Loop Set Label Properties)
for i=1:22
    SK.setLabel(i,'FontName','宋体','FontSize',12)
end
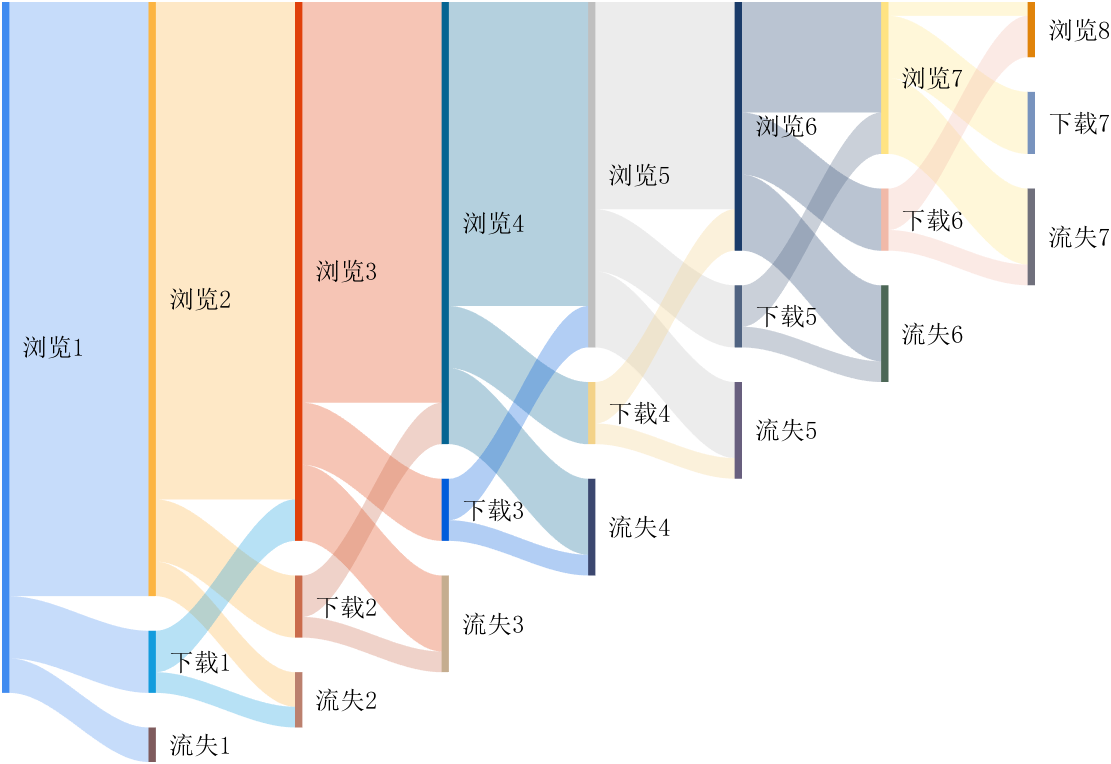
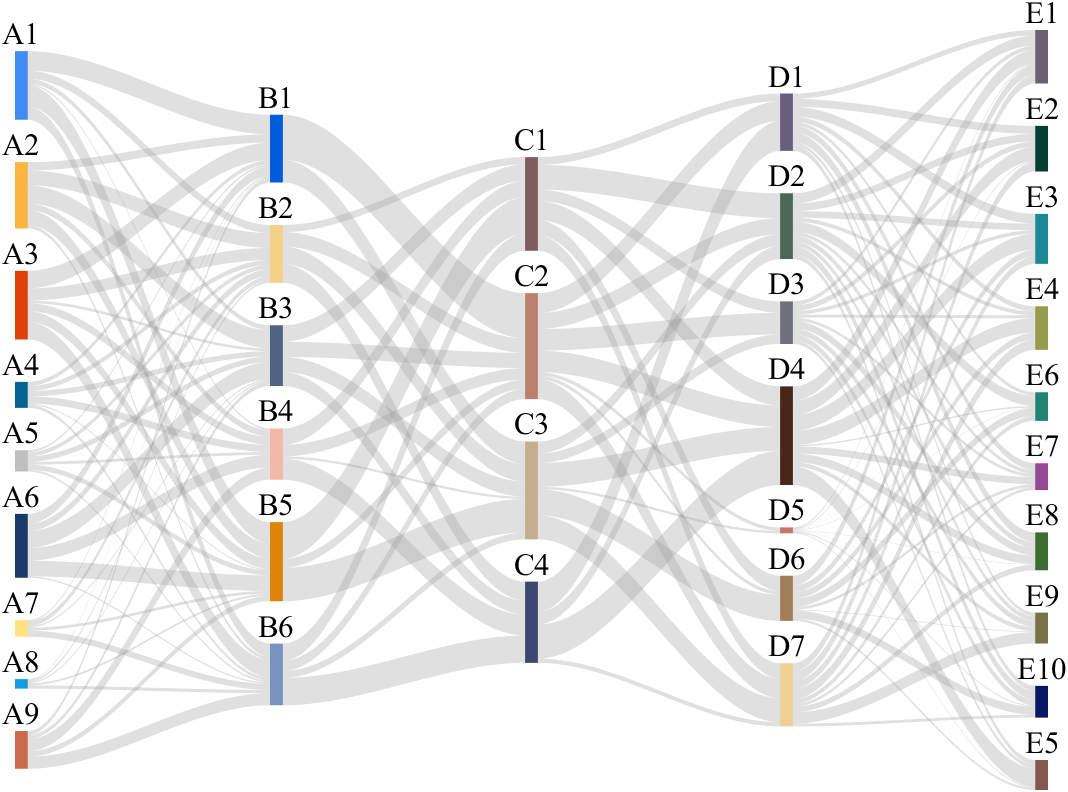
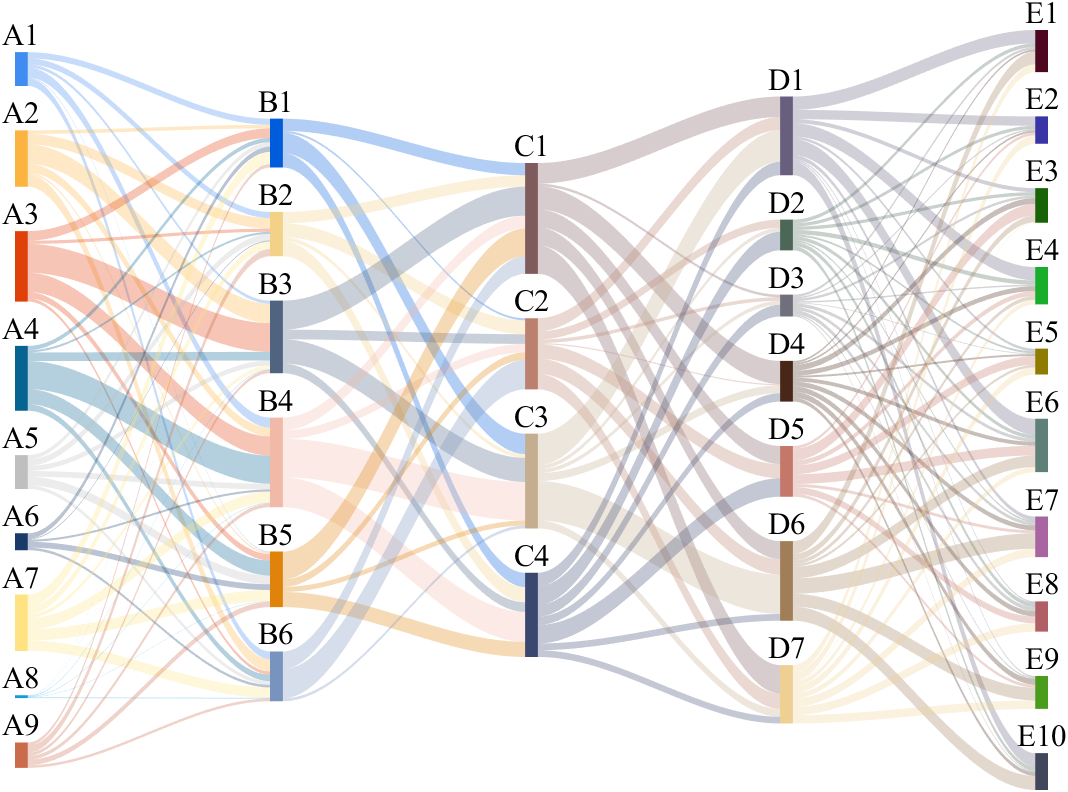
12 附加小案例(二)
% 随机生成数据(Randomly generated data)
clc;clear;
SourceValue=randi([1,30],[1,9]);
LayerNum=[9,6,4,7,10];
links{

    1,3}='';
for k=1:4
    TargetValue=zeros(1,LayerNum(k+1));
    for i=1:LayerNum(k)
        tValue=randi([0,13],[1,LayerNum(k+1)]);
        tValue=tValue./sum(tValue).*SourceValue(i);
        for j=1:LayerNum(k+1)
            TargetValue(j)=TargetValue(j)+tValue(j);
            if tValue(j)>eps
                tLen=size(links,1);
                links{

    tLen+1,1}=[char(64+k),num2str(i)];
                links{

    tLen+1,2}=[char(64+k+1),num2str(j)];
                links{

    tLen+1,3}=tValue(j);
            end
        end
    end
    SourceValue=TargetValue;
end
links(1,:)=[];

% 创建桑基图对象(Create a Sankey diagram object)
SK=SSankey(links(:,1),links(:,2),links(:,3));

% 修改链接颜色渲染方式(Set link color rendering method)
% 'left'/'right'/'interp'(default)/'map'/'simple'
SK.RenderingMethod='interp';

% 修改对齐方式(Set alignment)
% 'up'/'down'/'center'(default)
SK.Align='center';

% 修改文本位置(Set Text Location)
% 'left'(default)/'right'/'top'/'center'/'bottom'
SK.LabelLocation='top';

% 设置缝隙占比(Separation distance proportion)
SK.Sep=.4;

% 开始绘图(Start drawing)
SK.draw()
可自行调整渲染方式:

工具函数完整代码
classdef SSankey < handle
% Copyright (c) 2023, Zhaoxu Liu / slandarer
% =========================================================================
% @author : slandarer
% 公众号  : slandarer随笔
% 知乎    : slandarer
% -------------------------------------------------------------------------
% Zhaoxu Liu / slandarer (2023). sankey plot
% (https://www.mathworks.com/matlabcentral/fileexchange/128679-sankey-plot),
% MATLAB Central File Exchange. 检索来源 2023/4/28.
    properties
        Source;Target;Value;
        SourceInd;TargetInd;
        Layer;LayerPos;
        AdjMat;BoolMat;
        RenderingMethod='interp'  % 'left'/'right'/'interp'/'map'/'simple'
        LabelLocation='left'      % 'left'/'right'/'top'/'center'/'bottom'
        Align='center'            % 'up'/'down'/'center'
        BlockScale=0.05;          %  BlockScale>0 ! !
        Sep=0.05;                 %  Sep>=0 ! !
        NodeList={

    };
        ColorList=[[65,140,240;252,180,65;224,64,10;5,100,146;191,191,191;26,59,105;255,227,130;18,156,221;
                    202,107,75;0,92,219;243,210,136;80,99,129;241,185,168;224,131,10;120,147,190]./255;
                   [127,91,93;187,128,110;197,173,143;59,71,111;104,95,126;76,103,86;112,112,124;
                    72,39,24;197,119,106;160,126,88;238,208,146]./255];
        BlockHdl;LinkHdl;LabelHdl;ax;Parent;
        BN;LN;VN;TotalLen;SepLen;
        arginList={

    'RenderingMethod','LabelLocation','BlockScale',...
                   'Sep','Align','ColorList','Parent','NameList'}
    end
% 构造函数 =================================================================
    methods
        function obj=SSankey(varargin)
            % 获取基本数据 -------------------------------------------------
            if isa(varargin{

    1},'matlab.graphics.axis.Axes')
                obj.ax=varargin{

    1};varargin(1)=[];
            else
            end
            obj.Source=varargin{

    1};
            obj.Target=varargin{

    2};
            obj.Value=varargin{

    3};
            varargin(1:3)=[];
            % 获取其他信息 -------------------------------------------------
            for i=1:2:(length(varargin)-1)
                tid=ismember(obj.arginList,varargin{

    i});
                if any(tid)
                obj.(obj.arginList{

    tid})=varargin{

    i+1};
                end
            end
            if isempty(obj.ax)&&(~isempty(obj.Parent)),obj.ax=obj.Parent;end
            if isempty(obj.ax),obj.ax=gca;end
            obj.ax.NextPlot='add';
            % 基本数据预处理 -----------------------------------------------
            if isempty(obj.NodeList)
                obj.NodeList=[obj.Source;obj.Target];
                obj.NodeList=unique(obj.NodeList,'stable');
            end
            obj.BN=length(obj.NodeList);
            if length(obj.NodeList)>size(obj.ColorList,1)
                obj.ColorList=[obj.ColorList;rand(length(obj.NodeList),3).*.7];
            end
            obj.VN=length(obj.Value);
            % 坐标区域基础设置 ---------------------------------------------
            obj.ax.YDir='reverse';
            obj.ax.XColor='none';
            obj.ax.YColor='none';
        end
% Copyright (c) 2023, Zhaoxu Liu / slandarer
% =========================================================================
% @author : slandarer
% 公众号  : slandarer随笔
% 知乎    : slandarer
% -------------------------------------------------------------------------
% Zhaoxu Liu / slandarer (2023). sankey plot
% (https://www.mathworks.com/matlabcentral/fileexchange/128679-sankey-plot),
% MATLAB Central File Exchange. 检索来源 2023/4/28.
% 绘图函数 =================================================================
        function draw(obj)
            % 生成整体邻接矩阵 ---------------------------------------------
            obj.AdjMat=zeros(obj.BN,obj.BN);
            for i=1:length(obj.Source)
                obj.SourceInd(i)=find(strcmp(obj.Source{

    i},obj.NodeList));
                obj.TargetInd(i)=find(strcmp(obj.Target{

    i},obj.NodeList));
                obj.AdjMat(obj.SourceInd(i),obj.TargetInd(i))=obj.Value{

    i};
            end
            obj.BoolMat=abs(obj.AdjMat)>0;
            % 计算每个对象位于的层、每层方块长度、每个方块位置 ----------------
            obj.Layer=zeros(obj.BN,1);
            obj.Layer(sum(obj.BoolMat,1)==0)=1;
            startMat=diag(obj.Layer);
            for i=1:(obj.BN-1)
                tLayer=(sum(startMat*obj.BoolMat^i,1)>0).*(i+1);
                obj.Layer=max([obj.Layer,tLayer'],[],2);
            end
            obj.LN=max(obj.Layer);
            obj.TotalLen=max([sum(obj.AdjMat,1).',sum(obj.AdjMat,2)],[],2);
            obj.SepLen=max(obj.TotalLen).*obj.Sep;
            obj.LayerPos=zeros(obj.BN,4);
            for i=1:obj.LN
                tBlockInd=find(obj.Layer==i);
                tBlockLen=[0;cumsum(obj.TotalLen(tBlockInd))];
                tY1=tBlockLen(1:end-1)+(0:length(tBlockInd)-1).'.*obj.SepLen;
                tY2=tBlockLen(2:end)+(0:length(tBlockInd)-1).'.*obj.SepLen;
                obj.LayerPos(tBlockInd,3)=tY1;
                obj.LayerPos(tBlockInd,4)=tY2;
                % for j=1:length(tY2)
                %     plot([i,i],[tY1(j),tY2(j)],'LineWidth',2)
                % end
            end
            obj.LayerPos(:,1)=obj.Layer;
            obj.LayerPos(:,2)=obj.Layer+obj.BlockScale;
            % 根据对齐方式调整Y坐标 -----------------------------------------
            tMinY=min(obj.LayerPos(:,3));
            tMaxY=max(obj.LayerPos(:,4));
            for i=1:obj.LN
                tBlockInd=find(obj.Layer==i);
                tBlockPos3=obj.LayerPos(tBlockInd,3);
                tBlockPos4=obj.LayerPos(tBlockInd,4);
                switch obj.Align
                    case 'up'
                    case 'down'
                        obj.LayerPos(tBlockInd,3)=obj.LayerPos(tBlockInd,3)+tMaxY-max(tBlockPos4);
                        obj.LayerPos(tBlockInd,4)=obj.LayerPos(tBlockInd,4)+tMaxY-max(tBlockPos4);
                    case 'center'
                        obj.LayerPos(tBlockInd,3)=obj.LayerPos(tBlockInd,3)+...
                            min(tBlockPos3)/2-max(tBlockPos4)/2+tMinY/2-tMaxY/2;
                        obj.LayerPos(tBlockInd,4)=obj.LayerPos(tBlockInd,4)+...
                            min(tBlockPos3)/2-max(tBlockPos4)/2+tMinY/2-tMaxY/2;
                end
            end
            % 绘制连接 -----------------------------------------------------
            for i=1:obj.VN
                tSource=obj.SourceInd(i);
                tTarget=obj.TargetInd(i);
                tS1=sum(obj.AdjMat(tSource,1:(tTarget-1)))+obj.LayerPos(tSource,3);
                tS2=sum(obj.AdjMat(tSource,1:tTarget))+obj.LayerPos(tSource,3);
                tT1=sum(obj.AdjMat(1:(tSource-1),tTarget))+obj.LayerPos(tTarget,3);
                tT2=sum(obj.AdjMat(1:tSource,tTarget))+obj.LayerPos(tTarget,3);
                if isempty(tS1),tS1=0;end
                if isempty(tT1),tT1=0;end
                tX=[obj.LayerPos(tSource,1),obj.LayerPos(tSource,2),obj.LayerPos(tTarget,1),obj.LayerPos(tTarget,2)];
                qX=linspace(obj.LayerPos(tSource,1),obj.LayerPos(tTarget,2),200);qT=linspace(0,1,50);
                qY1=interp1(tX,[tS1,tS1,tT1,tT1],qX,'pchip');
                qY2=interp1(tX,[tS2,tS2,tT2,tT2],qX,'pchip');
                XX=repmat(qX,[50,1]);YY=qY1.*(qT'.*0+1)+(qY2-qY1).*(qT');
                MeshC=ones(50,200,3);
                switch obj.RenderingMethod
                    case 'left'
                        MeshC(:,:,1)=MeshC(:,:,1).*obj.ColorList(tSource,1);
                        MeshC(:,:,2)=MeshC(:,:,2).*obj.ColorList(tSource,2);
                        MeshC(:,:,3)=MeshC(:,:,3).*obj.ColorList(tSource,3);
                    case 'right'
                        MeshC(:,:,1)=MeshC(:,:,1).*obj.ColorList(tTarget,1);
                        MeshC(:,:,2)=MeshC(:,:,2).*obj.ColorList(tTarget,2);
                        MeshC(:,:,3)=MeshC(:,:,3).*obj.ColorList(tTarget,3);
                    case 'interp'
                        MeshC(:,:,1)=repmat(linspace(obj.ColorList(tSource,1),obj.ColorList(tTarget,1),200),[50,1]);
                        MeshC(:,:,2)=repmat(linspace(obj.ColorList(tSource,2),obj.ColorList(tTarget,2),200),[50,1]);
                        MeshC(:,:,3)=repmat(linspace(obj.ColorList(tSource,3),obj.ColorList(tTarget,3),200),[50,1]);
                    case 'map'
                        MeshC=MeshC(:,:,1).*obj.Value{

    i};
                    case 'simple'
                        MeshC(:,:,1)=MeshC(:,:,1).*.6;
                        MeshC(:,:,2)=MeshC(:,:,2).*.6;
                        MeshC(:,:,3)=MeshC(:,:,3).*.6;
                end
                obj.LinkHdl(i)=surf(obj.ax,XX,YY,XX.*0,'EdgeColor','none','FaceAlpha',.3,'CData',MeshC);
            end
            % 绘制方块 -----------------------------------------------------
            for i=1:obj.BN
                obj.BlockHdl(i)=fill(obj.ax,obj.LayerPos(i,[1,2,2,1]),...
                    obj.LayerPos(i,[3,3,4,4]),obj.ColorList(i,:),'EdgeColor','none');
            end
            % 绘制文本 -----------------------------------------------------
            for i=1:obj.BN
                switch obj.LabelLocation
                    case 'right'
                        obj.LabelHdl(i)=text(obj.ax,obj.LayerPos(i,2),mean(obj.LayerPos(i,[3,4])),...
                            [' ',obj.NodeList{

    i}],'FontSize',15,'FontName','Times New Roman','HorizontalAlignment','left');
                    case 'left'
                        obj.LabelHdl(i)=text(obj.ax,obj.LayerPos(i,1),mean(obj.LayerPos(i,[3,4])),...
                            [obj.NodeList{

    i},' '],'FontSize',15,'FontName','Times New Roman','HorizontalAlignment','right');
                    case 'top'
                        obj.LabelHdl(i)=text(obj.ax,mean(obj.LayerPos(i,[1,2])),obj.LayerPos(i,3),...
                            obj.NodeList{

    i},'FontSize',15,'FontName','Times New Roman','HorizontalAlignment','center','VerticalAlignment','bottom');
                    case 'center'
                        obj.LabelHdl(i)=text(obj.ax,mean(obj.LayerPos(i,[1,2])),mean(obj.LayerPos(i,[3,4])),...
                            obj.NodeList{

    i},'FontSize',15,'FontName','Times New Roman','HorizontalAlignment','center');
                    case 'bottom'
                        obj.LabelHdl(i)=text(obj.ax,mean(obj.LayerPos(i,[1,2])),obj.LayerPos(i,4),...
                            obj.NodeList{

    i},'FontSize',15,'FontName','Times New Roman','HorizontalAlignment','center','VerticalAlignment','top');
                end
            end
            % -------------------------------------------------------------
            axis tight;help SSankey
        end
% Copyright (c) 2023, Zhaoxu Liu / slandarer
% =========================================================================
% @author : slandarer
% 公众号  : slandarer随笔
% 知乎    : slandarer
% -------------------------------------------------------------------------
% Zhaoxu Liu / slandarer (2023). sankey plot
% (https://www.mathworks.com/matlabcentral/fileexchange/128679-sankey-plot),
% MATLAB Central File Exchange. 检索来源 2023/4/28.
% =========================================================================
        function setBlock(obj,n,varargin)
            set(obj.BlockHdl(n),varargin{

    :})
        end
        function setLink(obj,n,varargin)
            set(obj.LinkHdl(n),varargin{

    :})
        end
        function setLabel(obj,n,varargin)
            set(obj.LabelHdl(n),varargin{

    :})
        end
        function moveBlockY(obj,n,dy)
            obj.LayerPos(n,[3,4])=obj.LayerPos(n,[3,4])-dy;
            set(obj.BlockHdl(n),'YData',obj.LayerPos(n,[3,3,4,4]));
            switch obj.LabelLocation
                case 'right',set(obj.LabelHdl(n),'Position',[obj.LayerPos(n,2),mean(obj.LayerPos(n,[3,4]))]);
                case 'left',set(obj.LabelHdl(n),'Position',[obj.LayerPos(n,1),mean(obj.LayerPos(n,[3,4]))]);
                case 'top',set(obj.LabelHdl(n),'Position',[mean(obj.LayerPos(n,[1,2])),obj.LayerPos(n,3)]);
                case 'center',set(obj.LabelHdl(n),'Position',[mean(obj.LayerPos(n,[1,2])),mean(obj.LayerPos(n,[3,4]))]);
                case 'bottom',set(obj.LabelHdl(n),'Position',[mean(obj.LayerPos(n,[1,2])),obj.LayerPos(n,4)]);
            end
            for i=1:obj.VN
                tSource=obj.SourceInd(i);
                tTarget=obj.TargetInd(i);
                if tSource==n||tTarget==n
                    tS1=sum(obj.AdjMat(tSource,1:(tTarget-1)))+obj.LayerPos(tSource,3);
                    tS2=sum(obj.AdjMat(tSource,1:tTarget))+obj.LayerPos(tSource,3);
                    tT1=sum(obj.AdjMat(1:(tSource-1),tTarget))+obj.LayerPos(tTarget,3);
                    tT2=sum(obj.AdjMat(1:tSource,tTarget))+obj.LayerPos(tTarget,3);
                    if isempty(tS1),tS1=0;end
                    if isempty(tT1),tT1=0;end
                    tX=[obj.LayerPos(tSource,1),obj.LayerPos(tSource,2),obj.LayerPos(tTarget,1),obj.LayerPos(tTarget,2)];
                    qX=linspace(obj.LayerPos(tSource,1),obj.LayerPos(tTarget,2),200);qT=linspace(0,1,50);
                    qY1=interp1(tX,[tS1,tS1,tT1,tT1],qX,'pchip');
                    qY2=interp1(tX,[tS2,tS2,tT2,tT2],qX,'pchip');
                    YY=qY1.*(qT'.*0+1)+(qY2-qY1).*(qT');
                    set(obj.LinkHdl(i),'YData',YY);
                end
            end
        end
    end
% Copyright (c) 2023, Zhaoxu Liu / slandarer
% =========================================================================
% @author : slandarer
% 公众号  : slandarer随笔
% 知乎    : slandarer
% -------------------------------------------------------------------------
% Zhaoxu Liu / slandarer (2023). sankey plot
% (https://www.mathworks.com/matlabcentral/fileexchange/128679-sankey-plot),
% MATLAB Central File Exchange. 检索来源 2023/4/28.
end
完
本代码编写及案例选取真的不易,希望大家该点赞的点赞,该在看的在看!!
未经允许本代码请勿作商业用途,引用的话可以引用我file exchange上的链接,可使用如下格式:
Zhaoxu Liu / slandarer (2023). sankey plot (https://www.mathworks.com/matlabcentral/fileexchange/128679-sankey-plot), MATLAB Central File Exchange. 检索来源 2023/4/28.
若转载请保留以上file exchange链接及本文链接!!!!!
该工具可通过上述fileexchange链接获取,或者通过以下gitee仓库下载: