前面的作品可见:
数据可视化之美-动态图绘制(以Python为工具)
最近中了绘制动态图的毒,根本停不下来。

该篇博文是对上篇博文补充一些案例,并阐述一些绘图的优化。
绘动图之前准备工作
在运行程序之前,要确保 ImageMagic 安装好【下载链接】,然后就可以通过python的绘图工具包 matplotlib 保存 gif。
具体的安装教程可以见这篇博客【ImageMagic 安装教程】,准备工作完成了,然后就可以测试我们的案例了(包括上一篇博客的案例,以及这篇博客的案例)。见下。
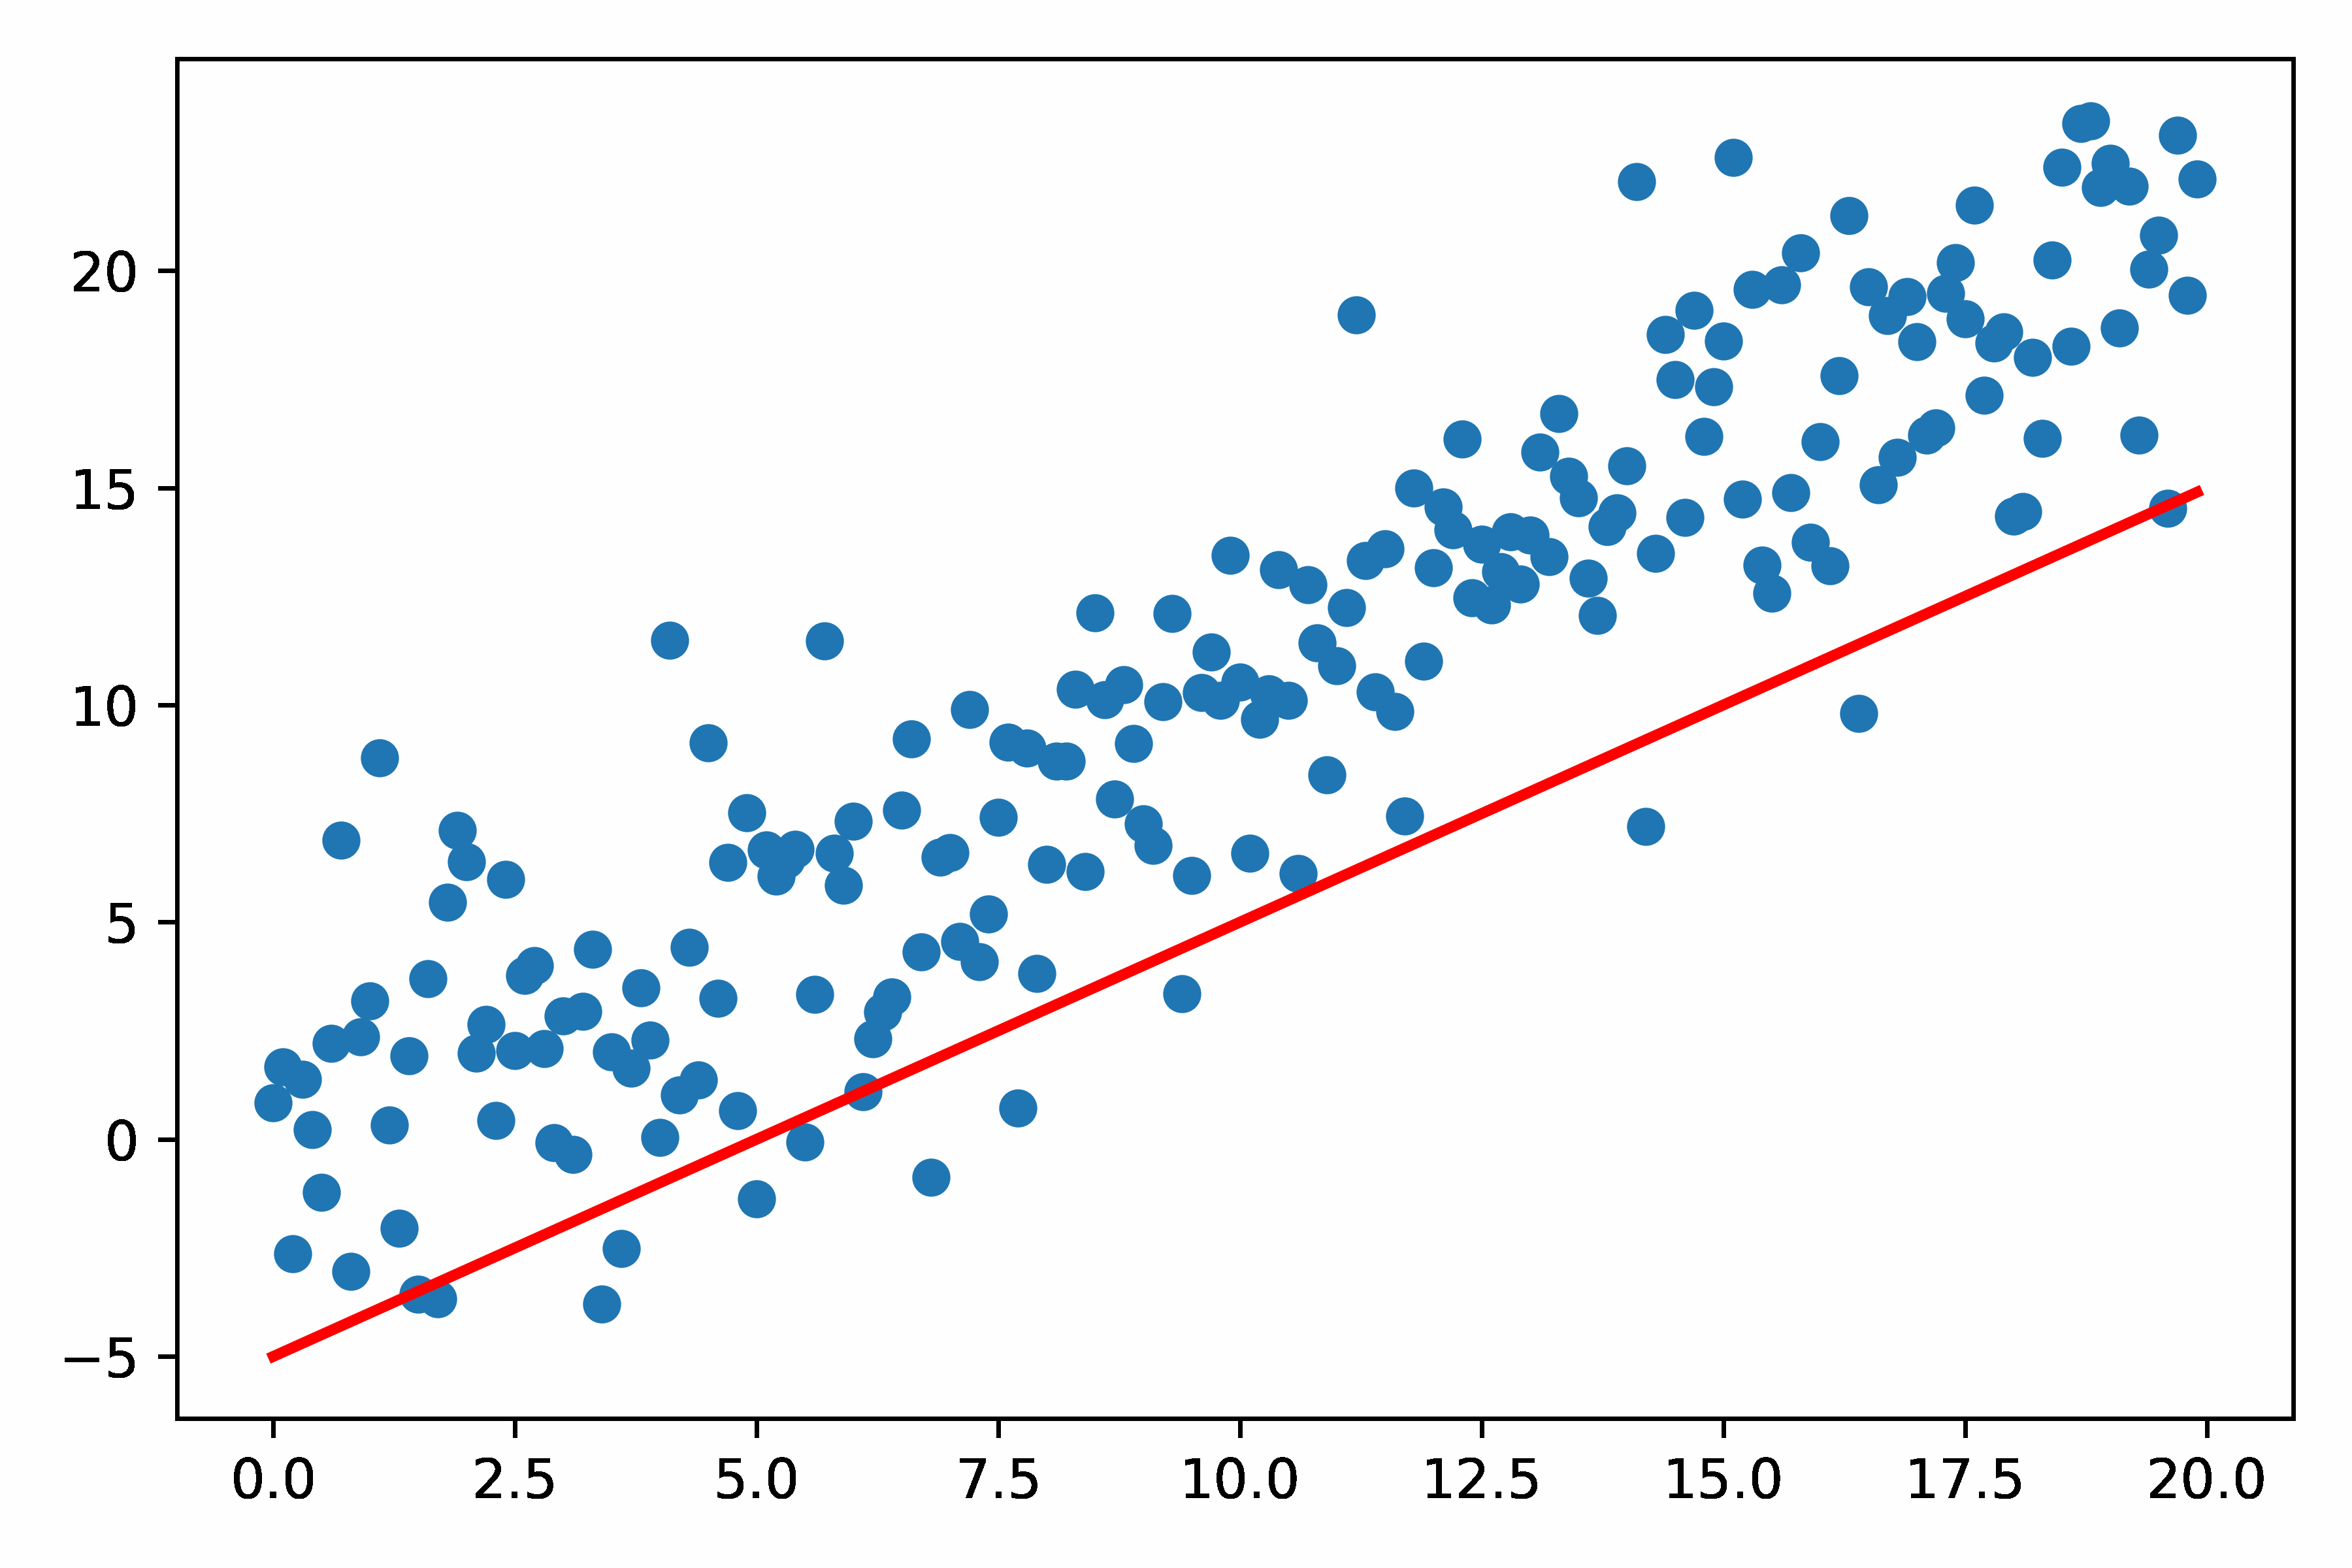
Test1:简单的Matplotlib 画 GIF 动图
- 图里的散点部分是不变的;变的是直线
- 也可以在图中添加其他元素,如时间(设置这些元素的变化)
- 我在这里优化了图的分辨率,使得GIF看起来更高清,见下面的代码串
anim.save('Test1_v1.gif', dpi=600, writer='imagemagick')
- 绘图所有的代码串见下:
import sys
import numpy as np
import matplotlib.pyplot as plt
from matplotlib.animation import FuncAnimation
# import seaborn

fig, ax = plt.subplots()
fig.set_tight_layout(True)

#  询问图形在屏幕上的尺寸和DPI(每英寸点数)。
#  注意当我们把图形储存成一个文件时,我们需要再另外提供一个DPI值
print('fig size: {0} DPI, size in inches {1}'.format(
    fig.get_dpi(), fig.get_size_inches()))

# 画出一个维持不变(不会被重画)的散点图和一开始的那条直线。
x = np.arange(0, 20, 0.1)
ax.scatter(x, x + np.random.normal(0, 3.0, len(x)))
line, = ax.plot(x, x - 5, 'r-', linewidth=2)

def update(i):
    label = 'timestep {0}'.format(i)
    print(label)
    # 更新直线和x轴(用一个新的x轴的标签)。
    # 用元组(Tuple)的形式返回在这一帧要被重新绘图的物体
    line.set_ydata(x - 5 + i)
    # ax.set_xlabel(label)
    return line, ax

if __name__ == '__main__':
    # FuncAnimation 会在每一帧都调用“update” 函数。
    # 在这里设置一个10帧的动画,每帧之间间隔200毫秒
    anim = FuncAnimation(fig, update, frames=np.arange(0, 10), interval=200)
    anim.save('Test1_v1.gif', dpi=600, writer='imagemagick')
    plt.show()
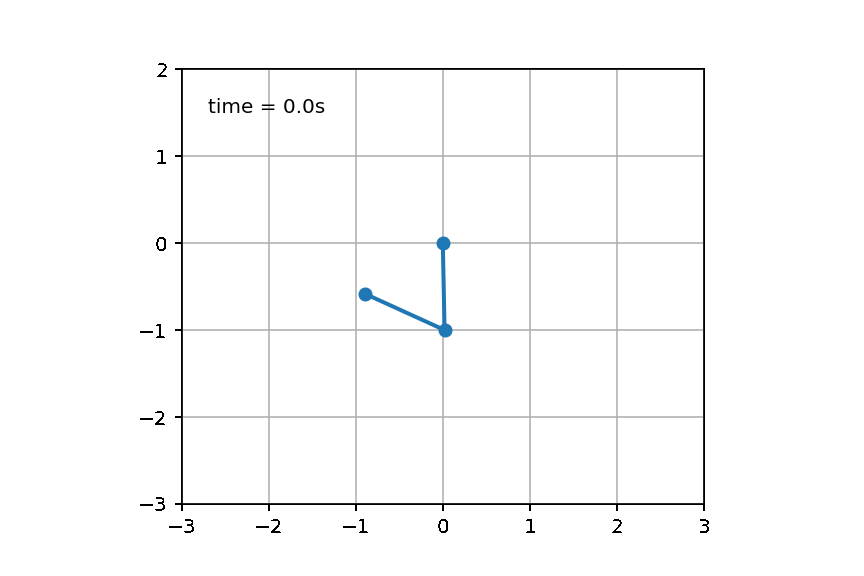
Test2:双摆问题
双摆是一个很经典的没有解析解的物理模型,如果对双摆公式感兴趣可见University of Sydney的物理专业的网页页面【双摆问题的介绍】:
底下这串代码也是通过更新数据的形式来更新动图里面的元素。见该部分
line.set_data(thisx, thisy)
time_text.set_text(time_template % (i*dt))
最终绘图所有的代码见下:
from numpy import sin, cos
import numpy as np
import matplotlib.pyplot as plt
import scipy.integrate as integrate
import matplotlib.animation as animation

G = 9.8  # acceleration due to gravity, in m/s^2
L1 = 1.0  # length of pendulum 1 in m
L2 = 1.0  # length of pendulum 2 in m
M1 = 1.0  # mass of pendulum 1 in kg
M2 = 1.0  # mass of pendulum 2 in kg

def derivs(state, t):

    dydx = np.zeros_like(state)
    dydx[0] = state[1]

    del_ = state[2] - state[0]
    den1 = (M1 + M2)*L1 - M2*L1*cos(del_)*cos(del_)
    dydx[1] = (M2*L1*state[1]*state[1]*sin(del_)*cos(del_) +
               M2*G*sin(state[2])*cos(del_) +
               M2*L2*state[3]*state[3]*sin(del_) -
               (M1 + M2)*G*sin(state[0]))/den1

    dydx[2] = state[3]

    den2 = (L2/L1)*den1
    dydx[3] = (-M2*L2*state[3]*state[3]*sin(del_)*cos(del_) +
               (M1 + M2)*G*sin(state[0])*cos(del_) -
               (M1 + M2)*L1*state[1]*state[1]*sin(del_) -
               (M1 + M2)*G*sin(state[2]))/den2
    return dydx

# create a time array from 0..100 sampled at 0.05 second steps
dt = 0.05
t = np.arange(0.0, 20, dt)

# th1 and th2 are the initial angles (degrees)
# w10 and w20 are the initial angular velocities (degrees per second)
th1 = 120.0
w1 = 0.0
th2 = -10.0
w2 = 0.0

# initial state
state = np.radians([th1, w1, th2, w2])

# integrate your ODE using scipy.integrate.
y = integrate.odeint(derivs, state, t)

x1 = L1*sin(y[:, 0])
y1 = -L1*cos(y[:, 0])

x2 = L2*sin(y[:, 2]) + x1
y2 = -L2*cos(y[:, 2]) + y1

fig = plt.figure()
ax = fig.add_subplot(111, autoscale_on=False, xlim=(-2, 2), ylim=(-2, 2))
ax.set_aspect('equal')
ax.grid()

line, = ax.plot([], [], 'o-', lw=2)
time_template = 'time = %.1fs'
time_text = ax.text(0.05, 0.9, '', transform=ax.transAxes)

def init():
    line.set_data([], [])
    time_text.set_text('')
    return line, time_text

def animate(i):
    thisx = [0, x1[i], x2[i]]
    thisy = [0, y1[i], y2[i]]

    line.set_data(thisx, thisy)
    time_text.set_text(time_template % (i*dt))
    return line, time_text

ani = animation.FuncAnimation(fig, animate, np.arange(1, len(y)),
                              interval=25, blit=True, init_func=init)

ani.save("dp-test2.gif", writer="imagemagick")
plt.show()
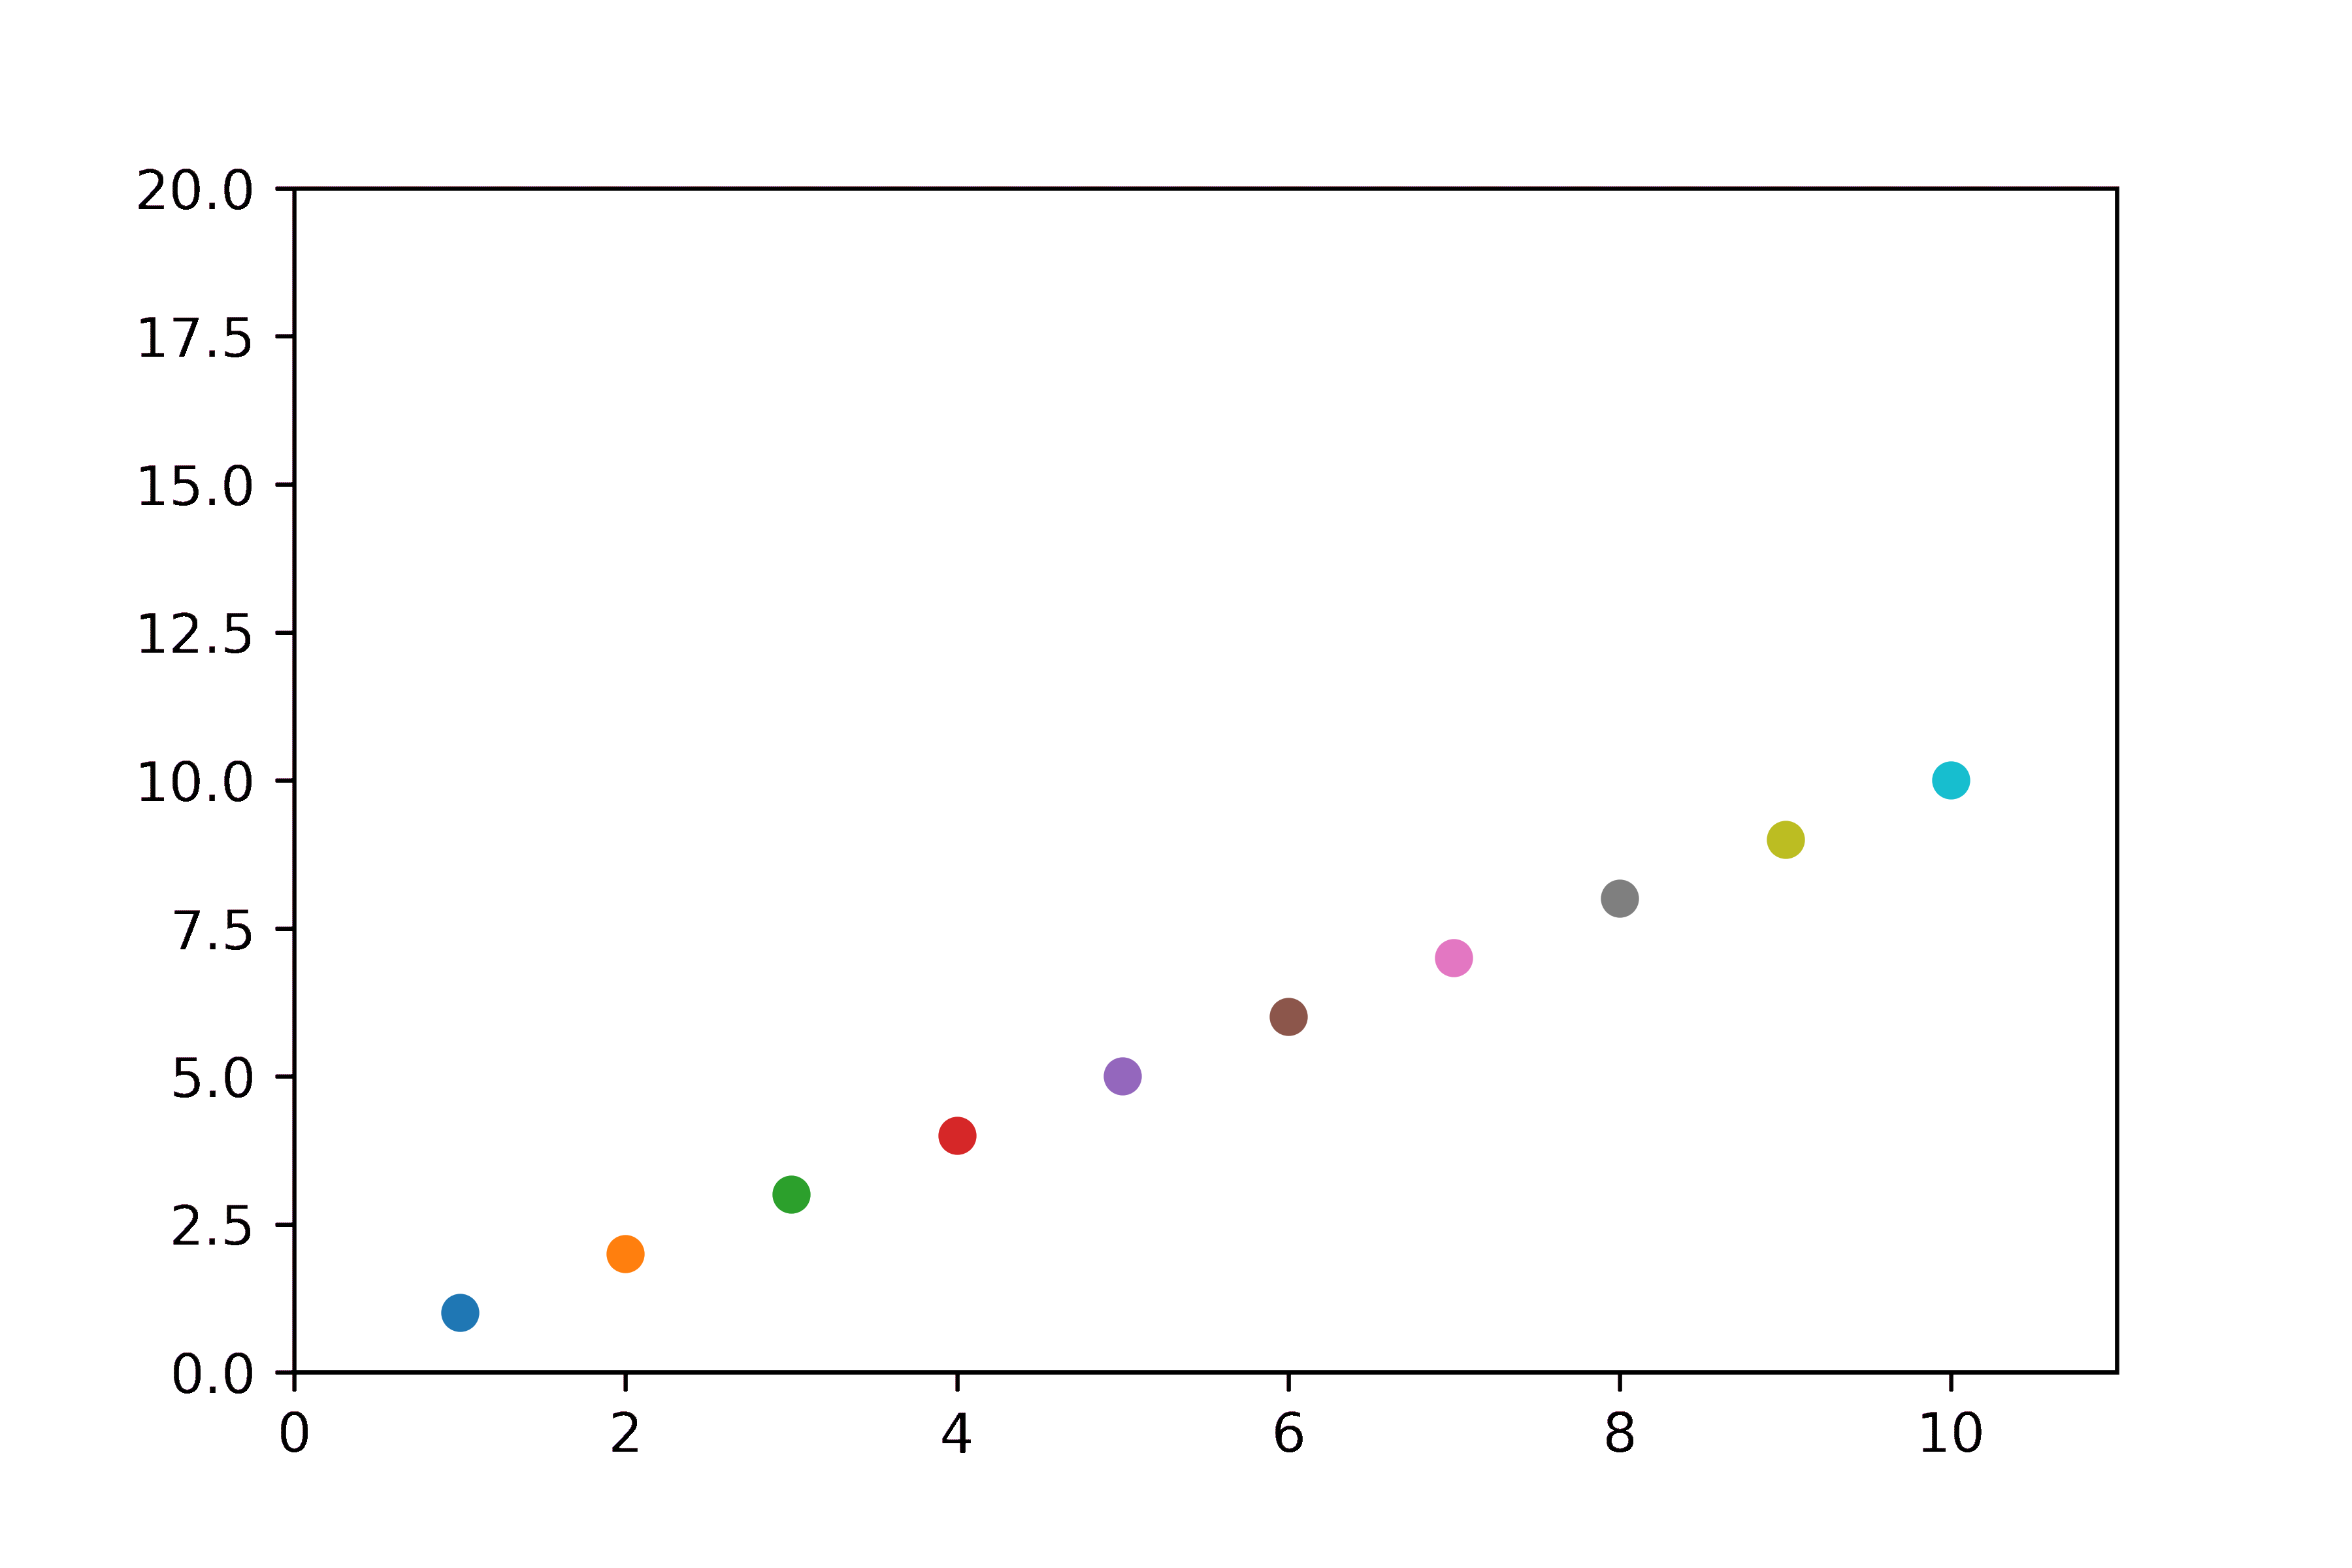
Test3:一次性更新多个对象
- 在这里也优化调整分辨率
- matplotlib的Funcanimation类,虽然简单,但是遇到一次性调整多个artist的问题是,会变得相当棘手,比如一次更新多个点的位置,使用Funcanimation就不太香了【上面的2个案例均是一次更新1个对象,所以用Funcanimation】,使用ArtistAnimation可以帮助我们在每一帧,更新若干个artist对象。
- ArtistAnimation是基于帧artist的一种动画创建方法,每一帧对应着一个artist的list,这些artist只会在这一帧显示,而所有的这些list组成一个大list,名叫artists,这个大list的每一个子list代表着每一帧的所有artist对象,从而渲染完整的动画。
import matplotlib.pyplot as plt
import matplotlib.animation as animation

if __name__ == '__main__':
    x = [1,2,3,4,5,6,7,8,9,10]
    y = [1,2,3,4,5,6,7,8,9,10]

    fig = plt.figure()
    plt.xlim(0, 11)
    plt.ylim(0, 20)

    artists = []
    # 总共10帧,每帧10个点
    for i in range(10):
        frame = []
        for j in range(10):
            frame += plt.plot(x[j], y[j]+i, "o")    # 注意这里要+=,对列表操作而不是appand
            artists.append(frame)

    ani = animation.ArtistAnimation(fig=fig, artists=artists, repeat=False, interval=10)
    plt.show()
    ani.save('test.gif', dpi=600, fps=30)
Test4:雨滴模拟
该图是用Matplotlib实现的雨滴模拟,来源于Nicolas P. Rougier

但自己的电脑显示出了一些渲染问题(边框的图案有点问题),这部分问题可能和个人电脑相关,暂时想不到解决方案:

import numpy as np
import matplotlib.pyplot as plt
from matplotlib.animation import FuncAnimation

# Fixing random state for reproducibility
np.random.seed(19680801)


# Create new Figure and an Axes which fills it.
fig = plt.figure(figsize=(7, 7))
ax = fig.add_axes([0, 0, 1, 1], frameon=False)
ax.set_xlim(0, 1), ax.set_xticks([])
ax.set_ylim(0, 1), ax.set_yticks([])

# Create rain data
n_drops = 50
rain_drops = np.zeros(n_drops, dtype=[('position', float, 2),
                                      ('size',     float, 1),
                                      ('growth',   float, 1),
                                      ('color',    float, 4)])

# Initialize the raindrops in random positions and with
# random growth rates.
rain_drops['position'] = np.random.uniform(0, 1, (n_drops, 2))
rain_drops['growth'] = np.random.uniform(50, 200, n_drops)

# Construct the scatter which we will update during animation
# as the raindrops develop.
scat = ax.scatter(rain_drops['position'][:, 0], rain_drops['position'][:, 1],
                  s=rain_drops['size'], lw=0.5, edgecolors=rain_drops['color'],
                  facecolors='none')


def update(frame_number):
    # Get an index which we can use to re-spawn the oldest raindrop.
    current_index = frame_number % n_drops

    # Make all colors more transparent as time progresses.
    rain_drops['color'][:, 3] -= 1.0/len(rain_drops)
    rain_drops['color'][:, 3] = np.clip(rain_drops['color'][:, 3], 0, 1)

    # Make all circles bigger.
    rain_drops['size'] += rain_drops['growth']

    # Pick a new position for oldest rain drop, resetting its size,
    # color and growth factor.
    rain_drops['position'][current_index] = np.random.uniform(0, 1, 2)
    rain_drops['size'][current_index] = 5
    rain_drops['color'][current_index] = (0, 0, 0, 1)
    rain_drops['growth'][current_index] = np.random.uniform(50, 200)

    # Update the scatter collection, with the new colors, sizes and positions.
    scat.set_edgecolors(rain_drops['color'])
    scat.set_sizes(rain_drops['size'])
    scat.set_offsets(rain_drops['position'])


# Construct the animation, using the update function as the animation director.
animation = FuncAnimation(fig, update, interval=10)
# plt.show()
animation.save('example4.gif', dpi=100, writer='pillow')
Other Test
还有一些其他的动图案例,如:柱状图的动画,脉冲星的假信号频率的比较路径演示,运动中流体中的流线绘制,等等,其原理大同小异。
最近还看到了2个优秀的动图可视化作品,拿出来分享一下。
优秀作品1
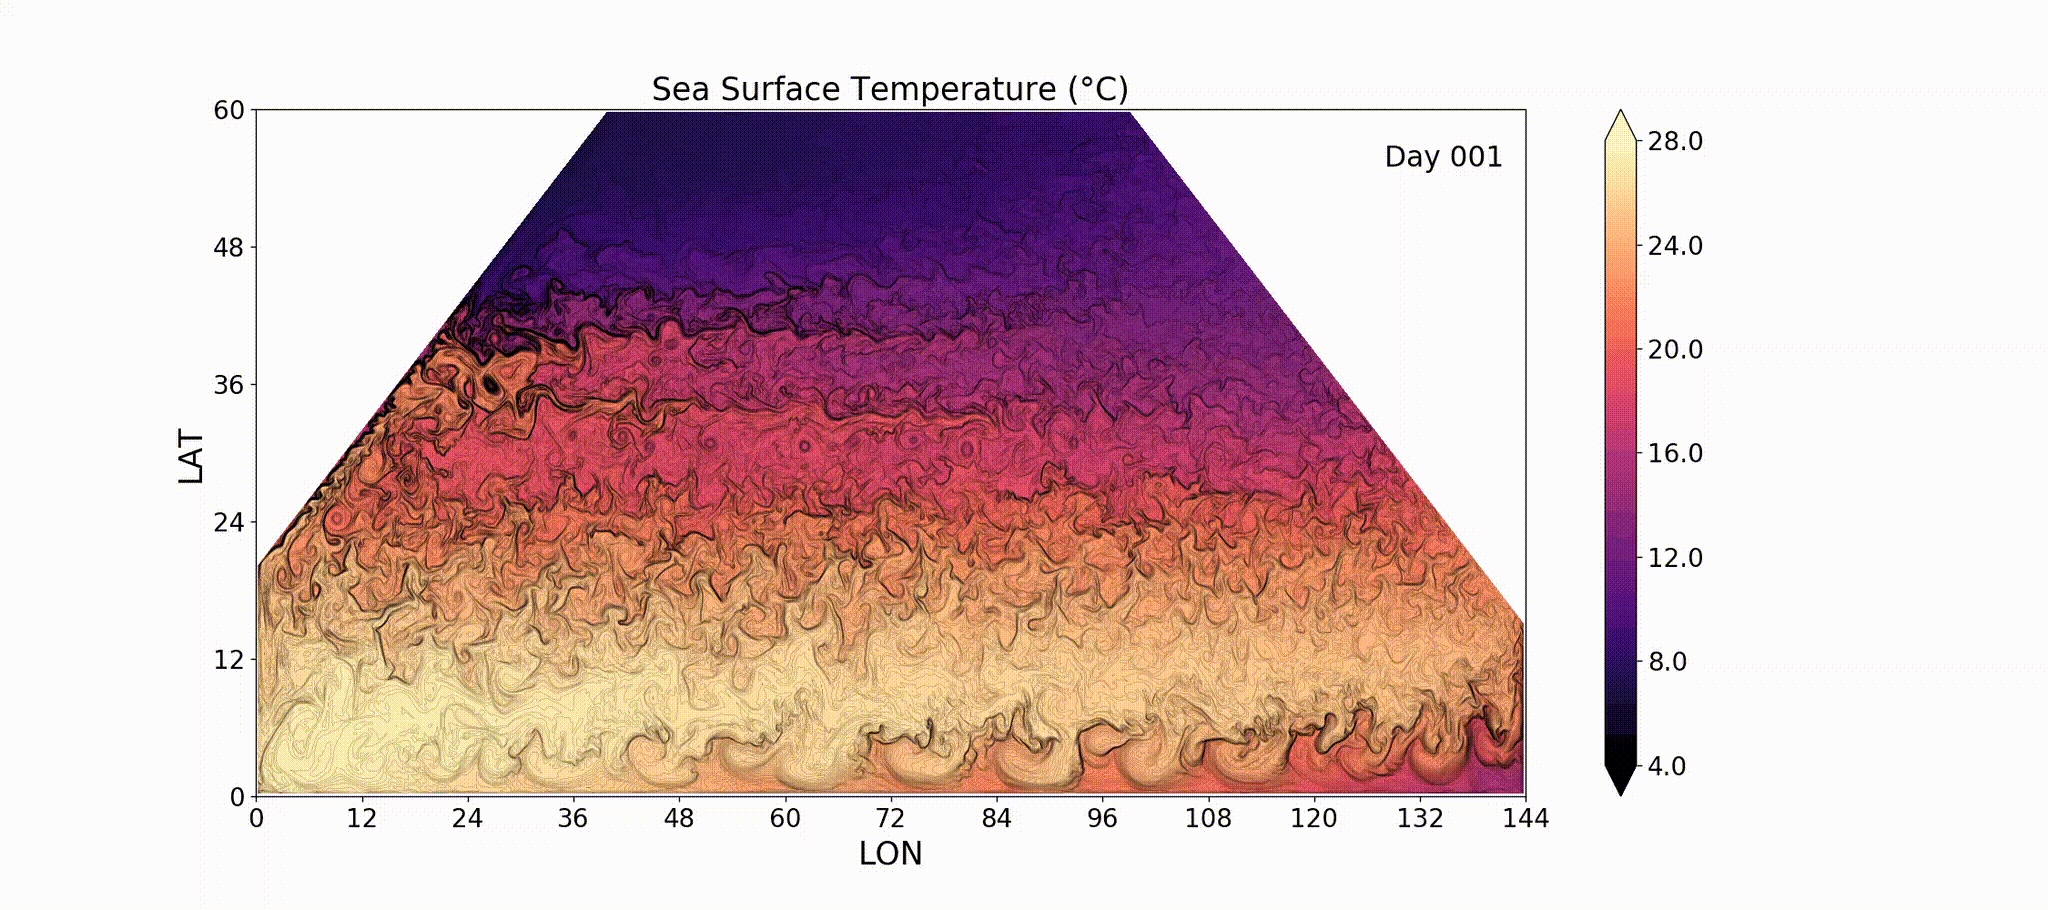
优秀作品2