http://ucanalytics.com/blogs/population-stability-index-psi-banking-case-study/
 and Dictators - by Roopam")
This is a continuation of the banking case study for the creation of application risk scorecards we have discussed in some previous articles. You could find the previous parts of the series at the following links (Part 1), (Part 2), (Part 3) and (Part 4).
In this article, we will discuss the Population Stability Index (PSI), an important metric to identify a shift in population for retail credit scorecards. Before we delve deeper into the calculation of the population stability index (PSI) and its utility, let’s try to understand the overall purpose of the PSI and similar indexes by connecting a few dots between..
Dictators and Credit Crisis
What is similar between Napoleon’s and then Hitler’s attempts to invade Russia and financial crisis of 2007-08?
Napoleon tried to invade Russia in 1812 and Hitler repeated Napoleon’s misdeeds in 1941 – both invasions ended with severe defeats for the armies of the dictators. The armies of both Napoleon and Hitler were far superior to the Russians. It was the conditions in which the battles were fought that resulted in these defeats. Russian winters are often held responsible for the fate of these armies. In reality, it was the ill-preparedness and bad judgment of both Napoleon’s and Hitler’s men that caused them the humiliating defeats. They were very well trained men but they were trained in benevolent conditions of France and Germany. This time, the battle was in completely different and extreme conditions, and they could not cope with it.
The failure of credit risk models during the financial crisis 0f 2007-08 could be related to the fate of both the French and German armies. The models were built and trained in a benevolent economic environment and were ill-prepared to deal with extreme economic conditions at the time. Additionally, there were series of bad judgments by the executives at the financial firms that resulted in total economic collapse.
The moral of the above stories is that one has to keep a close tab on a change in conditions in the currently prevalent environment and training environment. The Basel III accord has paid a significant attention towards monitoring portfolio on a regular basis for a good reason. The population stability index (PSI) is one such index that helps risk managers in performing this task for retail credit scorecards.
Population Stability Index (PSI) – Our Banking Case Continues
You are the chief-risk-officer at CyndiCat bank. It’s been a couple of years since your team, in your supervision, has built the auto-loans credit scorecard. Since then the overall risk assessment process for the bank has improved significantly. Though being a prudent risk manager you have asked your team to regularly compare the population for which the scorecard was built and the existing through-the-door population (applicants for auto loans). A good place to start this comparison is by checking how two populations are distributed across the risk bands created through the scorecard. The following is a representation for the latest quarterly comparison your team has performed against the benchmark sample. Here Actual %’ is the population distribution for the latest quarter and ‘Expected %’ is the population distribution for the validation sample (a.k.a. benchmark sample).

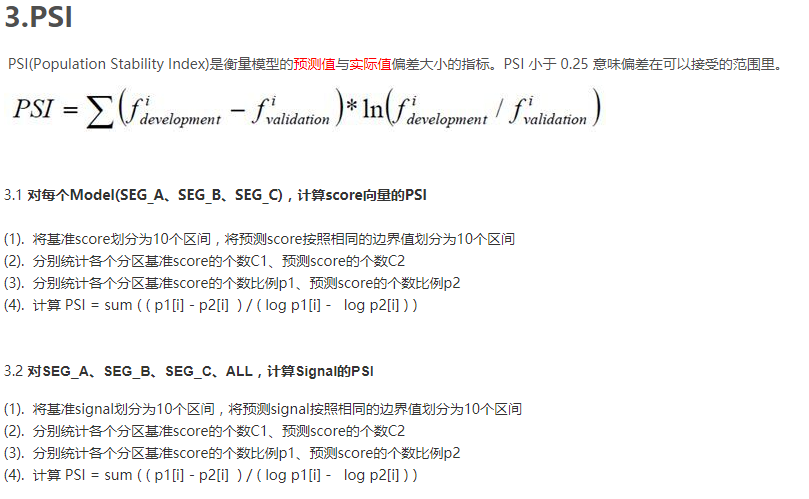
Comparing two populations visually is a good place to start. The current population seems to have shifted towards the right side of the graph. To a small extent, this is expected since scorecards often influence the through-the-door population as the market starts reacting to the approval strategies of the bank. However, the question we need to ask is whether this a major shift in the population? Essentially, you are comparing two different distributions and could use any goodness-of-fit measure such as Chi-square test. However, the population stability index is an industry-accepted metric that presents some convenient rules of thumb for the same. The population stability index (PSI) formula is displayed below (refer to ‘Credit Risk Scorecards’ by Naeem Siddiqui)
\times (ln(\frac{Actual\ \%}{Expected\ \%}))")
Again like the weight of evidence and the information value, PSI seems to have it’s root in information theory. Let’s calculate the population stability index (PSI) for our population (we have already seen a histogram for this above).
| Score bands | Actual % | Expected % | Ac-Ex | ln(Ac/Ex) | Index |
| < 251 | 5% | 8% | -3% | -0.47 | 0.014 |
| 251–290 | 6% | 9% | -3% | -0.41 | 0.012 |
| 291–320 | 6% | 10% | -4% | -0.51 | 0.020 |
| 321–350 | 8% | 13% | -5% | -0.49 | 0.024 |
| 351–380 | 10% | 12% | -2% | -0.18 | 0.004 |
| 381–410 | 12% | 11% | 1% | 0.09 | 0.001 |
| 411–440 | 14% | 10% | 4% | 0.34 | 0.013 |
| 441–470 | 14% | 9% | 5% | 0.44 | 0.022 |
| 471–520 | 13% | 9% | 4% | 0.37 | 0.015 |
| 520 < | 9% | 8% | 1% | 0.12 | 0.001 |
| Population Stability Index (PSI)= | 0.1269 | ||||
The last column in the above table is what we care for. Let us consider the score band 251-290 and calculate the index value for this row.
\times ln(\frac{6\ \%}{9\ \%})=0.012")
The final value for the PSI i.e. 0.13 is the sum of all the values of the last column. Now the question is how to interpret this value? The rule of thumb for the PSI is displayed below
| PSI Value | Inference | Action |
| Less than 0.1 | Insignificant change | No action required |
| 0.1 – 0.25 | Some minor change | Check other scorecard monitoring metrics |
| Greater than 0.25 | Major shift in population | Need to delve deeper |
The value of 0.13 falls in the second bucket which indicates a minor shift in population from the validation or benchmark sample. These are handy rules to have. However, one must ask, how is this population shift going to make any difference in the scorecard? Actually, it may or may not make any difference. Each score band of a scorecard has an associated bad rate or probability of customers not paying off their loans. For instance, score band 251-290 in our scorecard has a bad rate of 10% or one customer out of the population of 10 in this score band won’t service his/her loan. The population stability index simply indicates changes in the population of loan applicants. However, this may or may not result in deterioration in performance of the scorecard to predict risk. Nevertheless, the PSI indicates changes in the environment which need to be further investigated through analyzing the change in macroeconomic conditions and overall lending policies of the bank.
Sign-off Note
The population stability index is one of the metrics to keep a check on changing conditions – however, the idea is clear that one has to capture robust metrics to keep a close look on the ever changing economic winds to prevent a crash landing. On the other side, Russian winters did change the history of the planet for better – I guess change is not always for bad.
This was a bit of a detour from our previous article on books to learn probability and Bayesian statistics. Hopefully, you have got a chance to check out some of the books mentioned in the earlier article, see you soon with the second part of that article.