应粉丝要求,出一个类似于github热图的日历热力图,大概长这样:

依旧工具函数放在文末,如有bug请反馈并去gitee下载更新版。
使用教程
使用方式有以下几种会慢慢讲到:
- heatmapDT(Year,T,V)
- heatmapDT(Year,T,V,MonLim)
- heatmapDT(ax,Year,T,V)
- heatmapDT(ax,Year,T,V,MonLim)
基础使用
随便构造一组数据:
% 构造一组比较连续但是有波动的数据
T=datetime(2022,1,1):datetime(2022,12,31);
t=linspace(1,length(T),10);
tV=rand(size(t));
V=interp1(t,tV,1:length(T))+rand(1,[length(T)])./3;
这组数据大概是这样的:

绘制日历热力图并调整大小:
% 绘制日历热图
heatmapDT(2022,T,V)

% 调整图窗和坐标区域大小
set(gcf,'Position',[100,500,1500,260])
set(gca,'Position',[.03,.03,1-.1,1-.1])

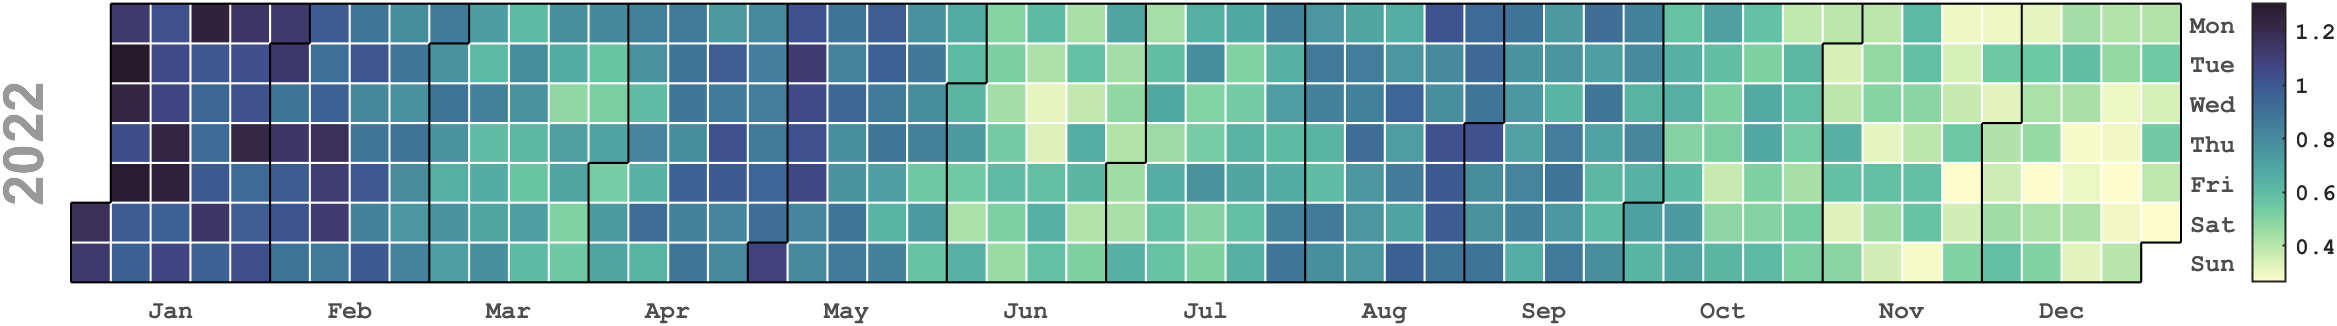
修改colormap(当然clim和caxis也能用)。
colormap(pink)

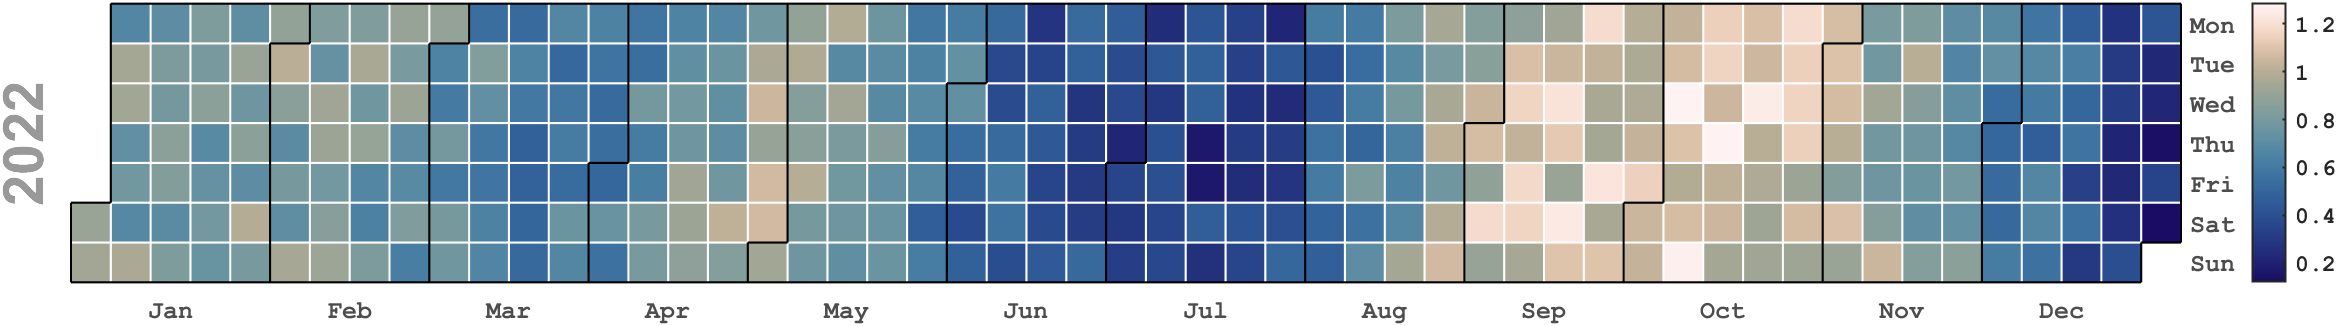
随便再换点颜色:


自己定义点颜色:
CM=[1.0000    1.0000    0.8510
    0.9487    0.9800    0.7369
    0.8617    0.9458    0.6995
    0.7291    0.8938    0.7109
    0.5237    0.8139    0.7308
    0.3433    0.7465    0.7558
    0.2036    0.6610    0.7629
    0.1155    0.5504    0.7444
    0.1298    0.4050    0.6759
    0.1398    0.2788    0.6160
    0.1141    0.1793    0.5162
    0.0314    0.1137    0.3451];
CMX=linspace(0,1,size(CM,1));
CMXX=linspace(0,1,256)';
CM=[interp1(CMX,CM(:,1),CMXX,'pchip'), ...
    interp1(CMX,CM(:,2),CMXX,'pchip'), ...
    interp1(CMX,CM(:,3),CMXX,'pchip')];
colormap(CM)

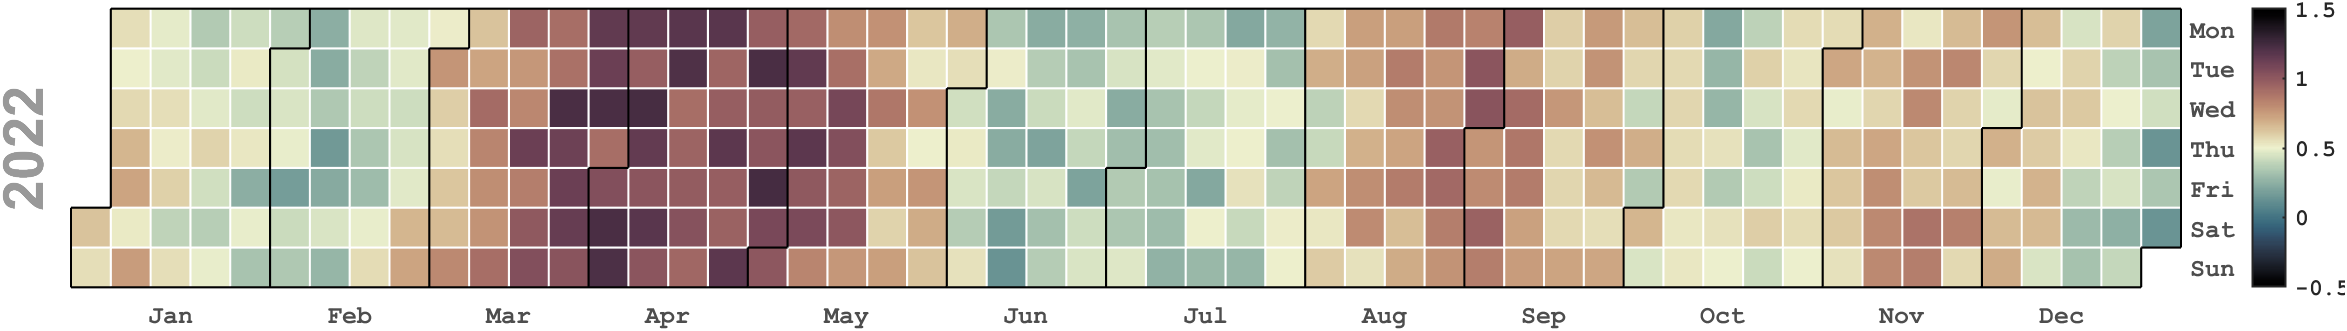
当然可以配合slanCM配色工具:https://slandarer.blog.csdn.net/article/details/127719784

使用效果:


空缺值
比如数据是2022年的,但是只有前半年数据(有空缺,那么空缺部分会用灰色补齐):
% 构造一组比较连续但是有波动的数据
T=datetime(2022,1,1):datetime(2022,6,30);
t=linspace(1,length(T),10);
tV=rand(size(t));
V=interp1(t,tV,1:length(T))+rand(1,[length(T)])./3;

% 绘制日历热图
heatmapDT(2022,T,V)

% 调整图窗和坐标区域大小
set(gcf,'Position',[100,500,1500,260])
set(gca,'Position',[.03,.03,1-.1,1-.1])


只画部分月份
猜到会有人想要这样的功能,只需要添加MonLim参数[a,b]即可,其中 1 ≤ a ≤ b ≤ 12 1\leq a\leq b\leq 12 1≤a≤b≤12,比如绘制二月热力图:
% 构造一组比较连续但是有波动的数据
T=datetime(2022,1,1):datetime(2022,12,31);
t=linspace(1,length(T),10);
tV=rand(size(t));
V=interp1(t,tV,1:length(T))+rand(1,[length(T)])./3;

% 绘制日历热图
heatmapDT(2022,T,V,[2,2])

% 调整图窗和坐标区域大小
set(gcf,'Position',[100,100,800,600])
set(gca,'Position',[.15,.15,1-.3,1-.3])

2-3月:
heatmapDT(2022,T,V,[2,3])

1-3月:
heatmapDT(2022,T,V,[1,3])

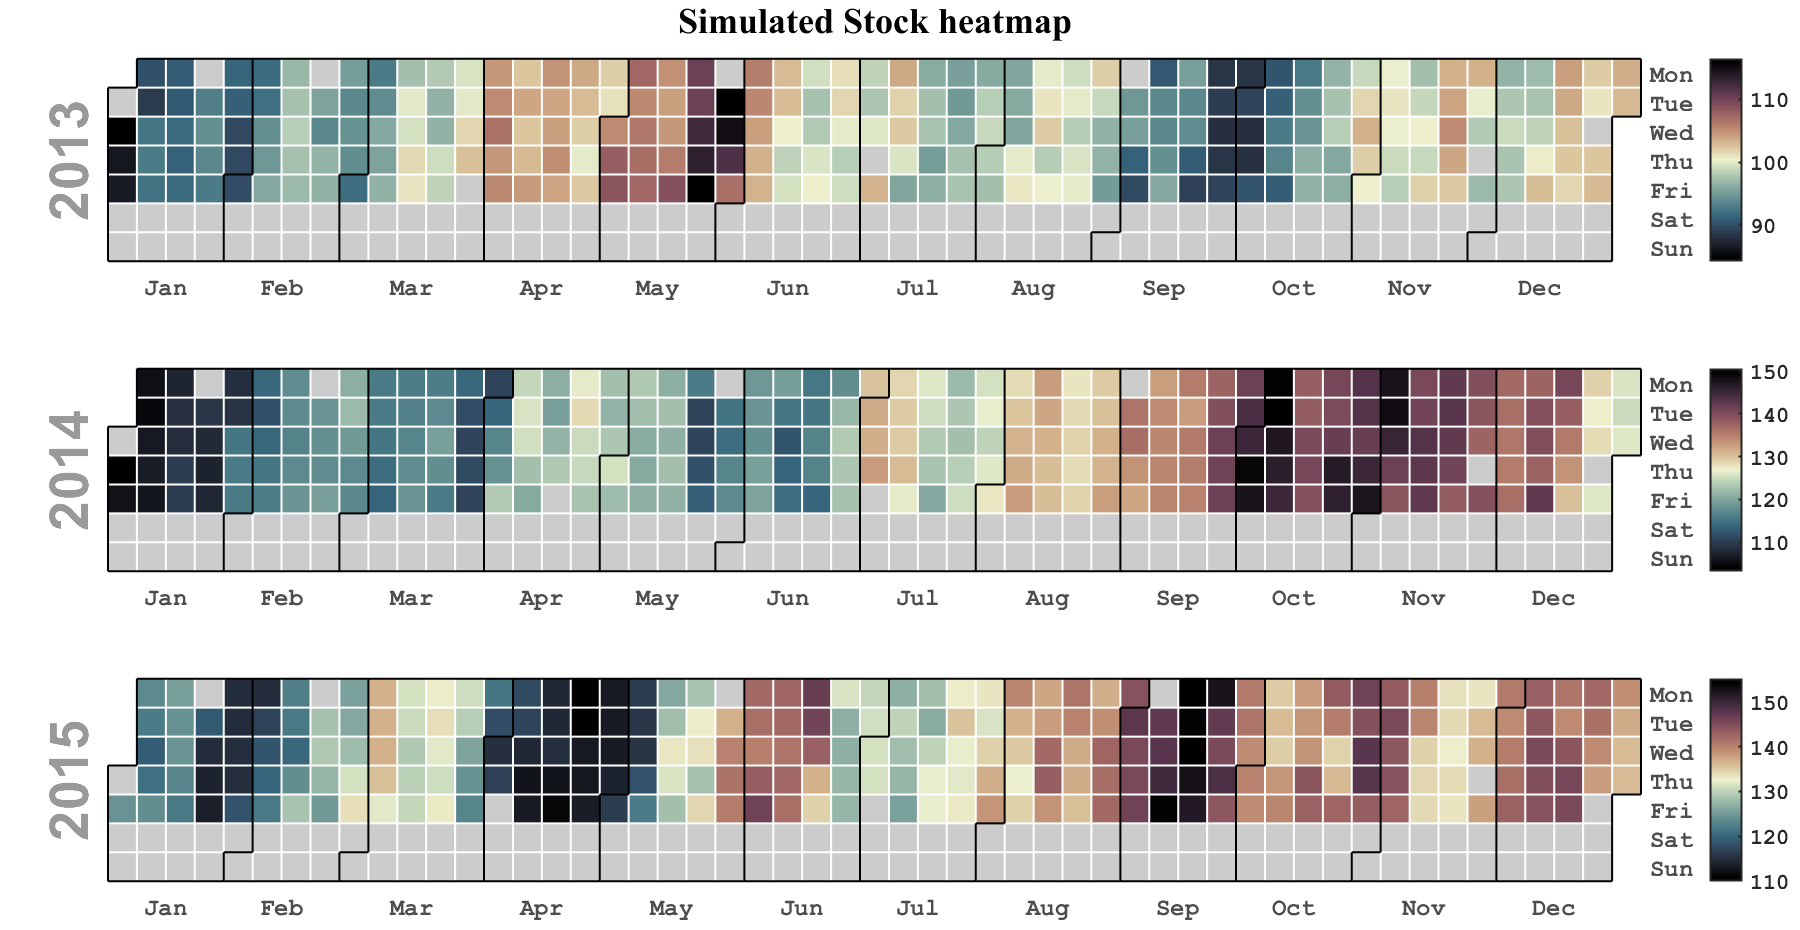
多子图
就将第一个参数设置为坐标区域即可,以下不用随机生成的数据了,用一个matlab Financial Toolbox工具箱自带的数据:
load SimulatedStock.mat

T=TMW.Time;
V=TMW.High;

% 绘制三个热力图
ax1=axes(gcf,'Position',[.06,2/3+.01,1-.07,1/3-.03]);
heatmapDT(ax1,2013,T,V)
ax2=axes(gcf,'Position',[.06,1/3+.01,1-.07,1/3-.03]);
heatmapDT(ax2,2014,T,V)
ax3=axes(gcf,'Position',[.06,0+.01,1-.07,1/3-.03]);
heatmapDT(ax3,2015,T,V)

% 绘制标题并调整位置
TT=title(ax1,{

    'Simulated Stock heatmap'},'FontSize',18,'FontWeight','bold','FontName','Times New Roman');
TT.Position(2)=-.1;

set(gcf,'Position',[100,100,1200,620])

随便试试自带colormap配色:


随便试试slanCM工具配色:


工具函数完整代码
function heatmapDT(varargin)
% @author:slandarer
% Zhaoxu Liu / slandarer (2023).
% calendar heatmap (https://www.mathworks.com/matlabcentral/fileexchange/125835-calendar-heatmap),
% MATLAB Central File Exchange. 检索来源 2023/3/7.

% 参数获取
if isa(varargin{

    1},'matlab.graphics.axis.Axes')
    ax=varargin{

    1};varargin(1)=[];
else
    ax=gca;
end
YY=varargin{

    1};
DT=varargin{

    2};
VAL=varargin{

    3};
MLim=[1,12];
try
    MLim=varargin{

    4};
catch
end

% 截取该年份日期及数值
BeginTime=datetime(YY,1,1);
EndTime=datetime(YY+1,1,1);
VAL=VAL(DT>=BeginTime&DT<EndTime);
DT=DT(DT>=BeginTime&DT<EndTime);
% 范围计算
DayName={

    'Mon','Tue','Wed','Thu','Fri','Sat','Sun'};
if MLim>=12
    FDT=datetime(YY,MLim(1),1):(datetime(YY+1,1,1)-1);
else
    FDT=datetime(YY,MLim(1),1):(datetime(YY,MLim(2)+1,1)-1);
end
[DayNumber,~]=weekday(FDT);
DayNumber(DayNumber==1)=8;
DayNumber=DayNumber-1;
TB=tabulate(DayNumber);
XLen=max(TB(:,2));
% 坐标区域修饰
hold on
ax.DataAspectRatio=[1,1,1];
ax.YLim=[.5,7.5];
ax.YDir='reverse';
ax.YTick=1:7;
ax.YTickLabel=DayName;
ax.YAxisLocation='right';
ax.FontName='Monospaced';
ax.FontWeight='bold';
ax.XColor=[.3,.3,.3];
ax.YColor=[.3,.3,.3];
% ax.Title.String=num2str(YY);
ax.FontSize=12;
% ax.LooseInset=[0,0,0,0];
FHdl=fill(ax,ax.XLim([1,1,2,2]),ax.YLim([1,2,2,1]),[1,1,1],'EdgeColor','w','LineWidth',2);
% 绘制灰色方块
xs=[-.5,-.5,.5,.5];ys=[-.5,.5,.5,-.5];
XList=zeros(1,length(FDT));
YList=zeros(1,length(FDT));
for i=1:length(FDT)
    XList(i)=sum(DayNumber==1&(1:length(FDT)<=i))+1;
    YList(i)=DayNumber(i);
    fill(ax,xs+XList(i),ys+YList(i),[.8,.8,.8],'EdgeColor','w','LineWidth',1)
end
% 绘制热力方块
for i=1:length(FDT)
    tPos=find(FDT(i)==DT, 1);
    if ~isempty(tPos)
        fill(ax,xs+XList(i),ys+YList(i),VAL(tPos),'EdgeColor','w','LineWidth',1)
    end
end
% 绘制外轮廓
MonNumber=month(FDT);
XDList=zeros(1,MLim(2)-MLim(1)+1);
n=1;
for i=MLim(1):MLim(2)
    XU=XList(MonNumber==i&DayNumber==1);
    plot([min(XU)-.5,max(XU)+.5],[.5,.5],'Color',[0,0,0],'LineWidth',1);
    XD=XList(MonNumber==i&DayNumber==7);
    XDList(n)=mean(XD);n=n+1;
    plot([min(XD)-.5,max(XD)+.5],[7.5,7.5],'Color',[0,0,0],'LineWidth',1);
    YL=YList(MonNumber==i&XList==max(XU));
    plot([max(XU)+.5,max(XU)+.5],[min(YL)-.5,max(YL)+.5],'Color',[0,0,0],'LineWidth',1);
    plot([max(XU)-.5,max(XU)-.5],[min(max(YL)+1,8)-.5,7+.5],'Color',[0,0,0],'LineWidth',1);
    plot([max(XU)+.5,max(XU)-.5],[max(YL)+.5,max(YL)+.5],'Color',[0,0,0],'LineWidth',1);
    if i==MLim(1)
        YR=YList(MonNumber==i&XList==min(XD));
        plot([min(XD)-.5,min(XD)-.5],[min(YR)-.5,max(YR)+.5],'Color',[0,0,0],'LineWidth',1);
        plot([min(XD)+.5,min(XD)+.5],[max(min(YR)-1,0)+.5,.5],'Color',[0,0,0],'LineWidth',1);
        plot([min(XD)-.5,min(XD)+.5],[min(YR)-.5,min(YR)-.5],'Color',[0,0,0],'LineWidth',1);
    end
end
ax.XLim=[.5,max(XList)+.5];
FHdl.XData=ax.XLim([1,1,2,2]);
ax.XTick=XDList;
MonName={

    'Jan','Feb','Mar','Apr','May','Jun','Jul','Aug','Sep','Oct','Nov','Dec'};
ax.XTickLabel=MonName(MLim(1):MLim(2));
% 设置colormap
CM=[1.0000    1.0000    0.8980
    0.9833    0.9937    0.8060
    0.9608    0.9851    0.7197
    0.8980    0.9600    0.6737
    0.8280    0.9312    0.6282
    0.7359    0.8915    0.5843
    0.6369    0.8486    0.5404
    0.5260    0.8005    0.4965
    0.4131    0.7482    0.4452
    0.2980    0.6918    0.3867
    0.2157    0.6196    0.3307
    0.1529    0.5380    0.2763
    0.0824    0.4737    0.2439
    0.0092    0.4152    0.2188
         0    0.3438    0.1901
         0    0.2706    0.1608];
disp(char([64 97 117 116 104 111 114 32 58 32,...
                 115 108 97 110 100 97 114 101 114]))
CMX=linspace(0,1,size(CM,1));
CMXX=linspace(0,1,256)';
CM=[interp1(CMX,CM(:,1),CMXX,'pchip'), ...
    interp1(CMX,CM(:,2),CMXX,'pchip'), ...
    interp1(CMX,CM(:,3),CMXX,'pchip')];
colormap(ax,CM);
CB=colorbar(ax);
CB.LineWidth=1;
% 绘制年份标题
text(ax,-0.2,4,num2str(YY),'Rotation',90,'HorizontalAlignment','center','VerticalAlignment','baseline',...
    'FontSize',27,'FontWeight','bold','Color',[.6,.6,.6])
end