一、在项目下使用命令行,安装echarts
npm install echarts --save二、在模板中准备一个容器,并设置好高度与宽度
<template>
    <div id="echartsdemo" ref="container"></div>
</template>

<style scoped lang="less">
#echartsdemo {
  width: 1000px;
  height: 500px;
  margin-top: 20px;
}
</style>
三、引入,我这里是局部引入,js部分
<script>
import * as echarts from "echarts";
var ROOT_PATH = "https://echarts.apache.org/examples";
const weatherIcons = {
Sunny: ROOT_PATH + "/data/asset/img/weather/sunny_128.png",
Cloudy: ROOT_PATH + "/data/asset/img/weather/cloudy_128.png",
Showers: ROOT_PATH + "/data/asset/img/weather/showers_128.png",
};
export default {
name: "MapTwo",
mounted() {
this.initOneEcharts();
},
methods: {
initOneEcharts() {
const option = {
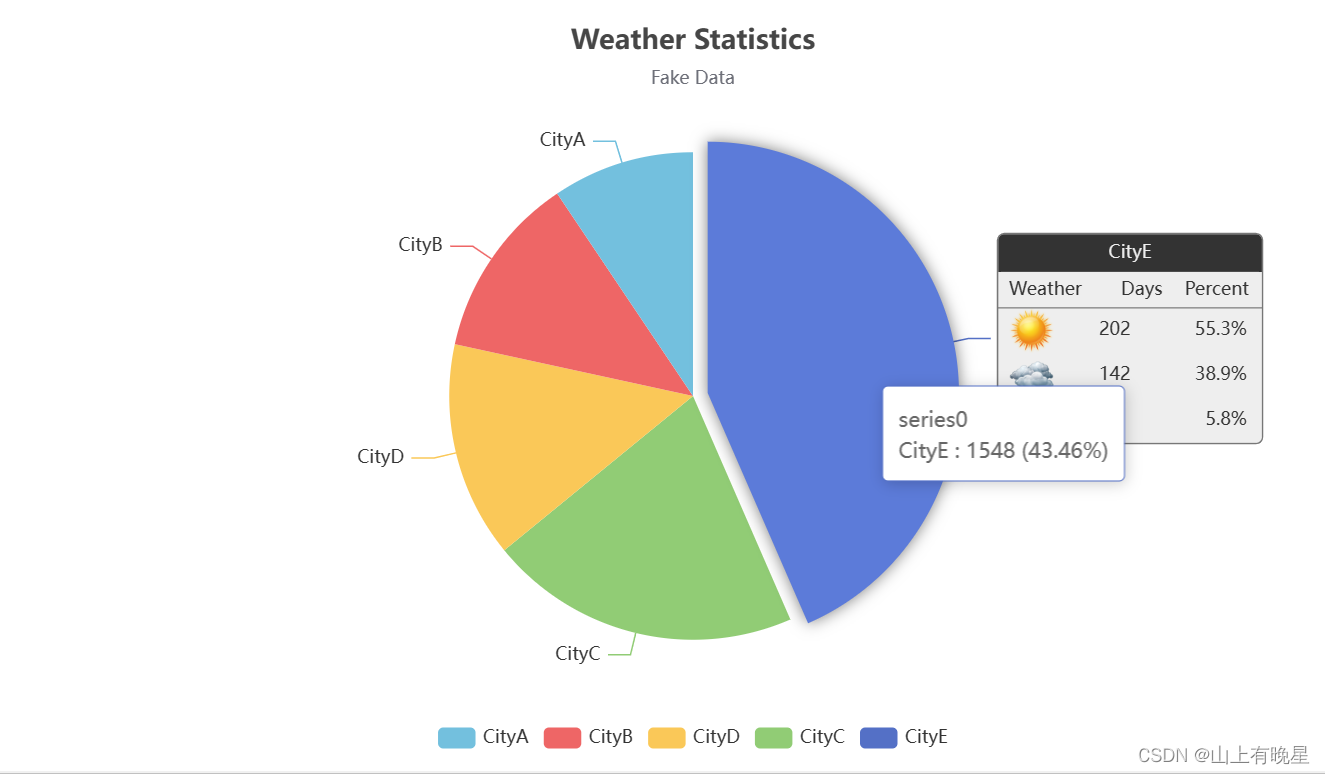
title: {
text: "Weather Statistics",
subtext: "Fake Data",
left: "center",
},
tooltip: {
trigger: "item",
formatter: "{a} <br/>{b} : {c} ({d}%)",
},
legend: {
bottom: 10,
left: "center",
data: ["CityA", "CityB", "CityD", "CityC", "CityE"],
},
series: [
{
type: "pie",
radius: "65%",
center: ["50%", "50%"],
selectedMode: "single",
data: [
{
value: 1548,
name: "CityE",
label: {
formatter: [
"{title|{b}}{abg|}",
" {weatherHead|Weather}{valueHead|Days}{rateHead|Percent}",
"{hr|}",
" {Sunny|}{value|202}{rate|55.3%}",
" {Cloudy|}{value|142}{rate|38.9%}",
" {Showers|}{value|21}{rate|5.8%}",
].join("\n"),
backgroundColor: "#eee",
borderColor: "#777",
borderWidth: 1,
borderRadius: 4,
rich: {
title: {
color: "#eee",
align: "center",
},
abg: {
backgroundColor: "#333",
width: "100%",
align: "right",
height: 25,
borderRadius: [4, 4, 0, 0],
},
Sunny: {
height: 30,
align: "left",
backgroundColor: {
image: weatherIcons.Sunny,
},
},
Cloudy: {
height: 30,
align: "left",
backgroundColor: {
image: weatherIcons.Cloudy,
},
},
Showers: {
height: 30,
align: "left",
backgroundColor: {
image: weatherIcons.Showers,
},
},
weatherHead: {
color: "#333",
height: 24,
align: "left",
},
hr: {
borderColor: "#777",
width: "100%",
borderWidth: 0.5,
height: 0,
},
value: {
width: 20,
padding: [0, 20, 0, 30],
align: "left",
},
valueHead: {
color: "#333",
width: 20,
padding: [0, 20, 0, 30],
align: "center",
},
rate: {
width: 40,
align: "right",
padding: [0, 10, 0, 0],
},
rateHead: {
color: "#333",
width: 40,
align: "center",
padding: [0, 10, 0, 0],
},
},
},
},
{ value: 735, name: "CityC" },
{ value: 510, name: "CityD" },
{ value: 434, name: "CityB" },
{ value: 335, name: "CityA" },
],
emphasis: {
itemStyle: {
shadowBlur: 10,
shadowOffsetX: 0,
shadowColor: "rgba(0, 0, 0, 0.5)",
},
},
},
],
};
echarts.init(document.getElementById("echartsdemo")).setOption(option);
},
},
};
<script>四、呈现结果如下