前言
在大多项目中,数据可视化往往都是必不可少的功能,但是如何将可视化做的华丽优雅又实用,希望这篇文章可以帮到你。(持续更新中)
一、Echarts基本安装及配置
1.导包
cnpm install echarts
2.main.js引入
import echarts from "echarts";
Vue.prototype.$echarts = echarts;
3.详细vue页面
<template>
  <div>
    <div id="myecharts"></div>
  </div>
</template>

<script>
var echarts = require("echarts");
export default {


  data() {


    return {


      charts: "",
    };
  },
  mounted() {


    this.$nextTick(function () {


      this.initchart();
      this.getData();
    });
  },
  methods: {


    initchart() {


      this.charts = echarts.init(
        document.getElementById("myecharts"),
        null,
        //防止缩放导致图标失帧
        {


          renderer: "svg",
        }
      );
    },
    getData() {


      //在这里进行数据的获取或据处理
      this.drawLine();
    },

    drawLine() {


      this.charts.setOption({


        //在这里制作你想要的的图标配置
        //https://echarts.apache.org/zh/index.html
      });
    },
  },
};
</script>
<style scoped>
#myecharts {


  width: 100%;
  height: 100%;
}
</style>
二、配置响应式Echarts样式大小
1.在methods中添加chartsAPI中的方法resize
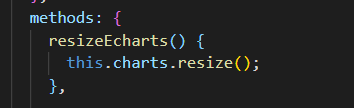
 resizeEcharts() {


      this.charts.resize();
    },
2.在渲染完后监听外部容器大小生成新的echarts组件
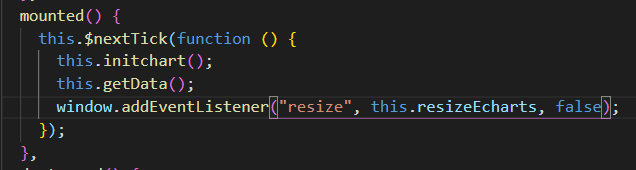
window.addEventListener("resize", this.resizeEcharts, false);
3.最后销毁
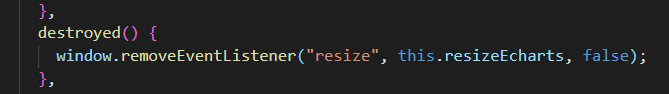
 destroyed() {


    window.removeEventListener("resize", this.resizeEcharts, false);
  },