文章目录
使用Prometheus监控远程主机实战
1.node_exporter的介绍
官网给提供了数据采集的组件: node_exporter, prometheus只能拉取数据,而Exporter是Prometheus的指标数据收集组件。
它负责从目标Jobs收集数据,并把收集到的数据转换为Prometheus支持的时序数据格式。
和传统的指标数据收集组件不同的是,它只负责收集数据,并不向Server端发送数据,而是等待Prometheus Server 主动抓取。
node-exporter 默认的抓取url地址:http://ip:9100/metrics
如果想要让node_exporter推送数据,可以借助于工具 pushgetway组件,这个组件可以推送node_exporter的指标数据到你安装好的prometheus服务器上。
node-exporter用于采集node的运行指标,包括node的cpu、load、filesystem、meminfo、network等基础监控指标,类似于zabbix监控系统的的zabbix-agent
2.实验环境
如表:
| 操纵系统 | 服务器IP | 主机名 |
|---|---|---|
| CentOS7.6 | 192.168.66.61 | localhost61 |
| CentOS7.6 | 192.168.66.63 | localhost63 |
3.查看相应的参数
3.1.查看操纵系统:
[root@localhost ~]# cat /etc/redhat-release
CentOS Linux release 7.6.1810 (Core)
3.2.查看hostname
[root@localhost ~]# hostnamectl set-hostname localhost61
[root@localhost ~]# bash
[root@localhost61 ~]# hostname
localhost61
3.3.查看IP
[root@localhost61 ~]# ifconfig | grep inet | awk 'NR=1{print $2}'
192.168.66.61
fe80::9d57:84cb:3342:a387
192.168.138.61
fe80::ac61:2cfd:e94e:212c
127.0.0.1
::1
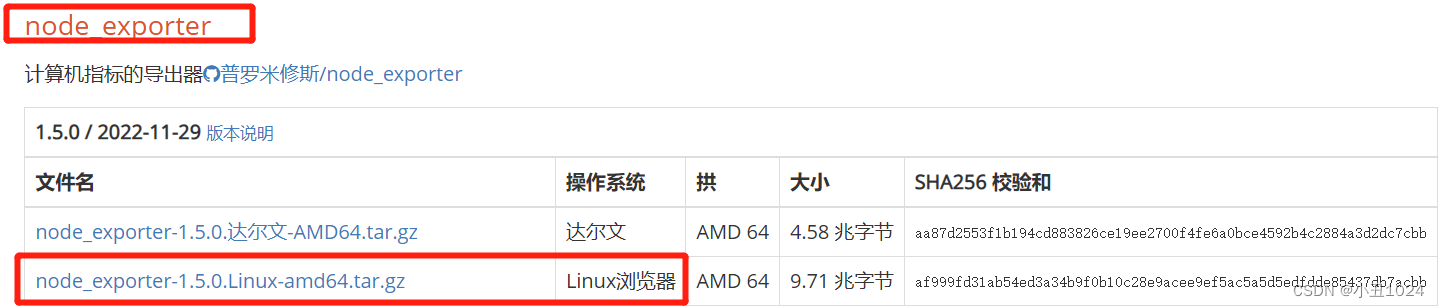
4.安装node-exporter(节点入口)
node-exporter(节点入口)
Prometheus网址:
https://prometheus.io/download/
扫描二维码关注公众号,回复:
14668482 查看本文章

4.1.上传node-exporter
[root@localhost63 ~]# ls
anaconda-ks.cfg  node_exporter-1.5.0.linux-amd64.tar.gz
4.2.解压node-exporter
[root@localhost63 ~]# tar xvf node_exporter-1.5.0.linux-amd64.tar.gz
[root@localhost63 ~]# mv node_exporter-1.5.0.linux-amd64 node_exporter
[root@localhost63 ~]# ls
anaconda-ks.cfg  node_exporter-1.5.0.linux-amd64.tar.gz
node_exporter
[root@localhost63 ~]# cd node_exporter
[root@localhost63 node_exporter]# ls
LICENSE  node_exporter  NOTICE
4.3.启动node-exporter
1.开始启动node-porter
默认情况下, node_exporter 端口是在 9100 上运行,并在路径 /metrics 上暴 露指标,此处也可以修改
[root@localhost63 node_exporter]# nohup ./node_exporter  &
[1] 6989
[root@localhost63 node_exporter]# nohup: 忽略输入并把输出追加到"nohup.out"

#启动并设置在后台运行,这里nohup命令,主要用于在系统后台不挂断地运行命令,退出终端不会影响程序的运行。

#nohup 命令,在默认情况下(非重定向时),会输出一个名叫 nohup.out 的文件到当前目录下,如果当前目录的 nohup.out 文件不可写,输出重定向到 $HOME/nohup.out 文件中。
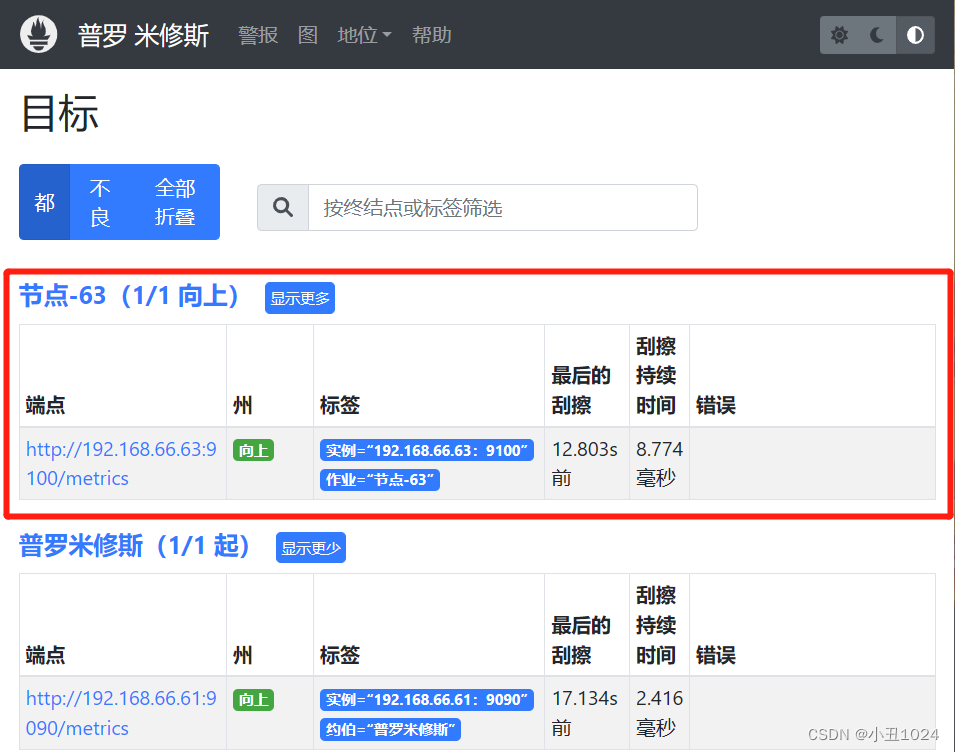
监控远程主机端设置完毕 使用 ifconfig 查询远程主机 ip 为192.168.66.63,而node_exporter端口为9100
5.修改服务端Prometheus下的 prometheus.yml 文件,添加节点IP
[root@localhost61 prometheus]# vim prometheus.yml
添加内容:
  - job_name: "node-63"
    static_configs:
      - targets: ["192.168.66.63:9100"]

[root@localhost61 prometheus]#  pkill prometheus 	#杀死Prometheus进程
[root@localhost61 prometheus]#  ./prometheus & 	#重新启动prometheus
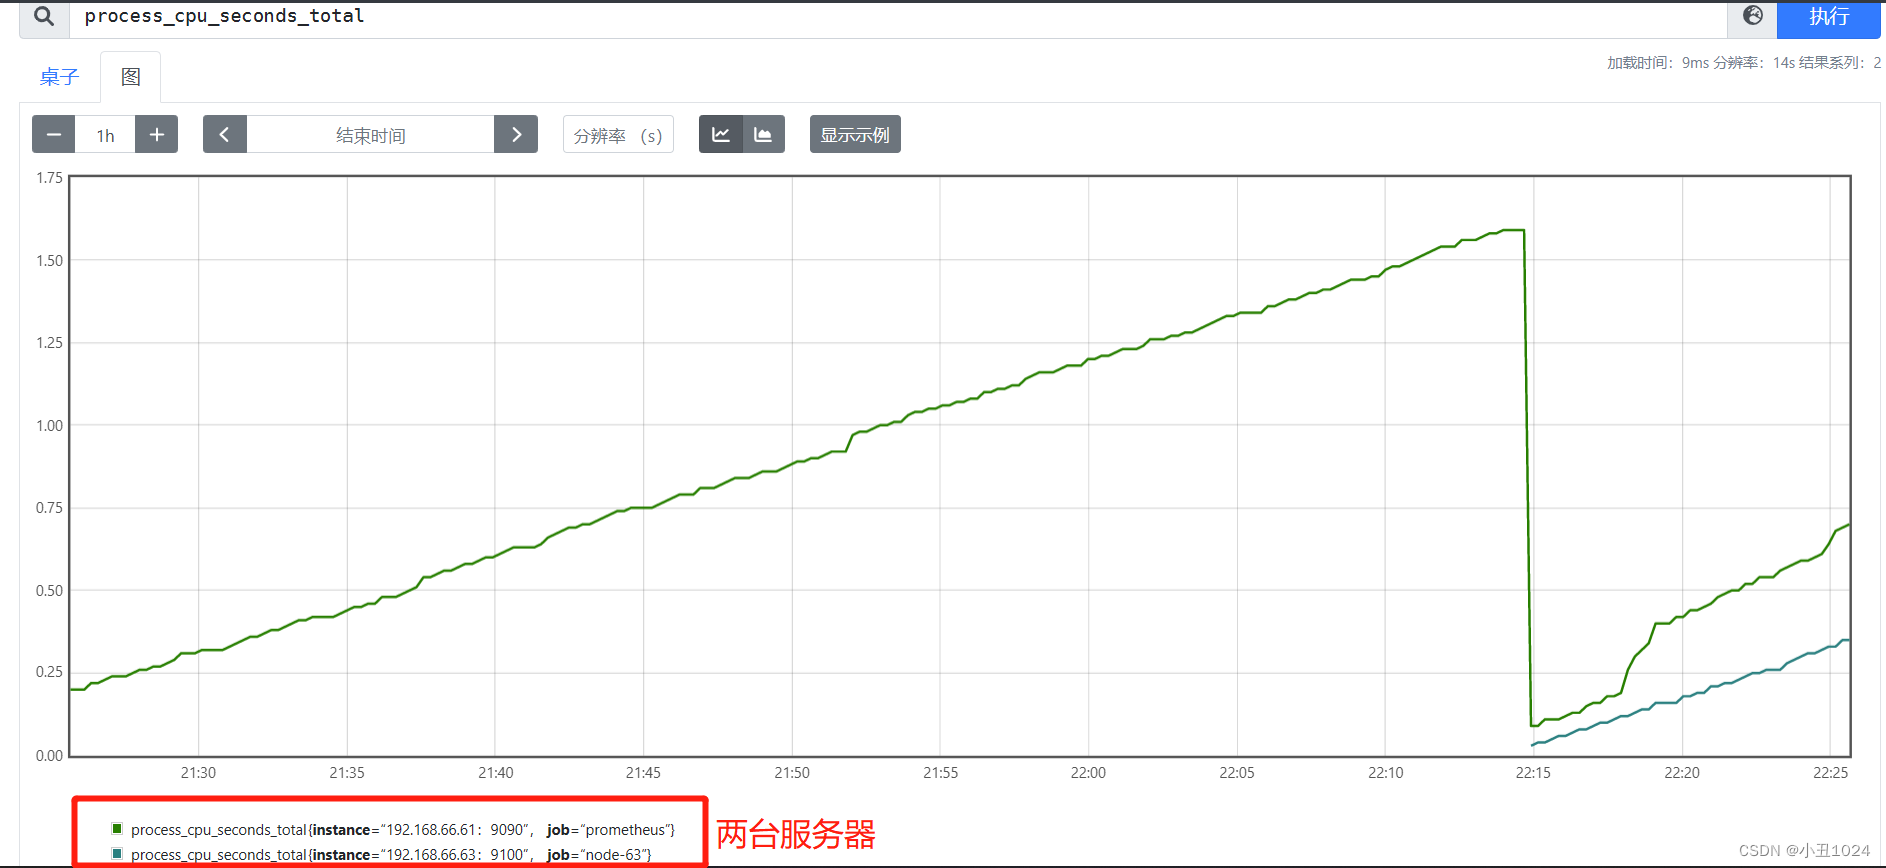
6.刷新网页端重新查看Status下的Targets 出现远程主机监控数据