问题描述
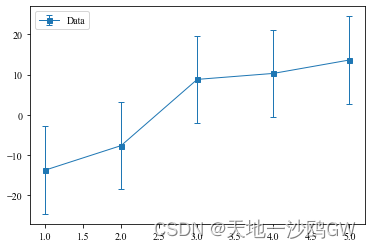
在使用matplotlib中的errorbar函数绘制误差图时,自动生成的图例中会有符号和误差线,而误差线会阻碍符号的识别,且看着不美观

# 举个例子
import matplotlib.pyplot as plt
import numpy as np
from numpy import random

#make some toy data
x = [1,2,3,4,5]
y = random.normal(scale=15, size = 5)

y_err = np.std(y)

plt.errorbar(x,y,y_err,label='Data',marker='s', ms=5, lw = 1, capsize=3)
plt.legend()
plt.show()
运行后如下图,图例看着很难看
只需要改成
import matplotlib.pyplot as plt
from matplotlib import container
import numpy as np
from numpy import rando

x = [1,2,3,4,5]
y = random.normal(scale=15, size = 5)

y_err = np.std(y)

plt.errorbar(x,y,y_err,label='Data',marker='s', ms=5, lw = 1, capsize=3)
'''添加部分_开始'''
ax = plt.gca()
handles, labels = ax.get_legend_handles_labels(
handles = [h[0] if isinstance(h, container.ErrorbarContainer) else h for h in handles
'''添加部分_结束'''
ax.legend(handles, labels) # 注意此处修改
plt.show()
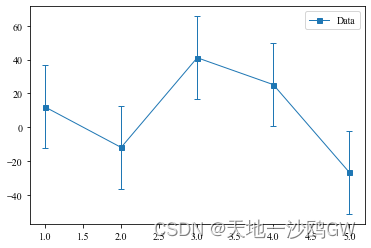
运行后图如下
注:本文转载自Stuart W D Grieve博客,地址:https://swdg.io/