tensorboard 的详细使用
在深度学习训练网络的过程中,由于网络训练过程时间长,不可能一直关注训练中的每一轮结果,因此我们需要将训练过程中的结果可视化,留作后续的查看,从而确定训练过程是否出错。因此,我们需要使用到可视化工具,常用的几种可视化工具有:
tensorboard、wandb(在线可视化)这里主要介绍tensorboard的使用,wandb的使用可参考我的另一篇博客 wandb的基本使用。
1、安装 tensorboard 库
pip install tensorboard
2、tensorboard 的使用
2.1 书写代码,保存日志文件
# 引入tensorboard库
from torch.utils.tensorboard import SummaryWriter

# 实例化summary对象,log_dir表示日志的存放路径(自己设置)
writer = SummaryWriter(log_dir="./log")

# 接下来就可以存储日志信息,日志信息可进行可视化展示
...
writer.add_xxx(...) # 一系列操作
2.2 可视化展示
# 在命令行终端,输入tensorboard命令进行可视化
tensorboard --logdir=日志文件存放的目录
# 比如:日志文件存放在log文件夹下,则写法如下
tensorboard --logdir=./log

# 运行成功后,会生成一个链接:http://localhost:6006/,点击即可进入可视化页面。
PS D:\PythonProjects\Object-Detection\skills\tensorboard_show\log> tensorboard --logdir=./
TensorFlow installation not found - running with reduced feature set.
Serving TensorBoard on localhost; to expose to the network, use a proxy or pass --bind_all
TensorBoard 2.6.0 at http://localhost:6006/ (Press CTRL+C to quit)

3、常用方法
3.1 绘制单条曲线图
# 绘制单条曲线
epochs = 10
for i in range(epochs):
    # 当前处于第几步
    step = i + 1
    # 参数依次为:曲线图的标题、每一步的数据、当前第几步
    writer.add_scalar("y=2*x", 2 * i, step)

3.2 绘制多条曲线图
# 2、绘制多条曲线
epochs = 100
for i in range(epochs):
    step = i + 1
    # 参数依次为:主标题、字典(每条曲线的标题和对应值)、当前第几步
    writer.add_scalars("scalars", {


        "y=2x": 2 * i,
        "y=3x+1": 3 * i + 1
    }, step)

3.3 绘制直方图
# 绘制histogram直方图
epochs = 10
for i in range(epochs):
    step = i + 1
    # 随机生成1000个符合正态分布的数据
    data = np.random.randn(1000)
    # 标题、数据、当前第几步、直方图区间的个数
    writer.add_histogram("distribution of data", data, step, bins=10)

3.4 绘制图像
绘制图像,有两种办法:
一种是使用
numpy或者tensor格式的图像数组,另一种是使用matplotlib绘制的图像。
3.4.1 方法一
# 1、使用numpy或者tensor格式的图像数组
epochs = 5
for i in range(epochs):
    step = i + 1
    # numpy或者tensor格式的图像数组
    img = Image.open("../../left_color.png").convert('RGB')
    # 将PIL对象转换为numpy数组
    img_numpy = np.array(img, dtype=np.uint8)
    # (720, 1280, 3) 高、宽、通道(HWC)
    # print(img_numpy.shape)
    # 标题、图像数据、当前第几步、图像的格式(HWC表示高宽通道,默认是通道高宽,需要和上述生成的numpy数组在格式上保持一致)
    writer.add_image("image", img_numpy, step, dataformats="HWC")

3.4.2 方法二
# 2、使用plot绘制的图像,渲染(figure)
epochs = 5
# 生成模拟数据
x = np.linspace(0, 10, 1000)
y = np.sin(x)
# 生成figure对象
figure = plt.figure()
# 绘制折线图
plt.plot(x, y, 'r-')
for i in range(epochs):
    step = i + 1
    # 标题、图或图列表、当前第几步
    writer.add_figure("figure", figure, step)

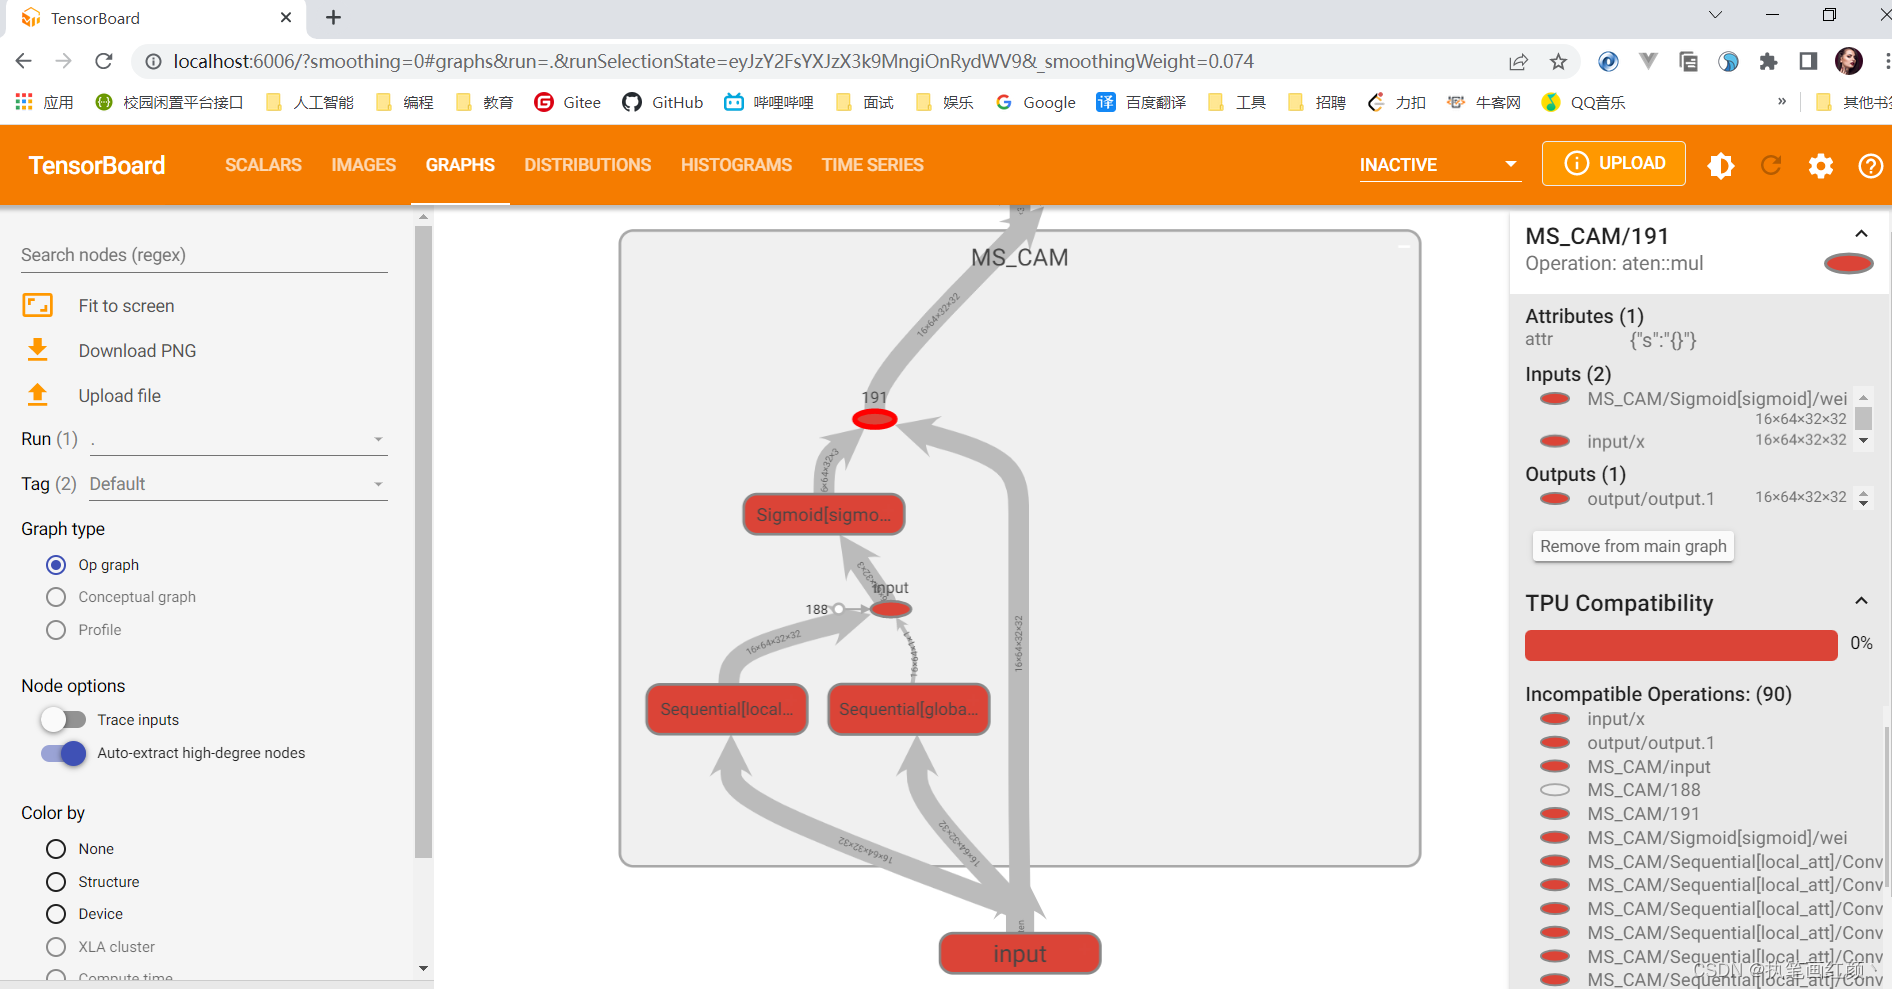
3.5 绘制网络架构图
# 创建模型
model = MS_CAM()
# 模拟一个模型的输入数据(16batch、64通道、32*32宽高)
input = torch.FloatTensor(np.random.rand(16, 64, 32, 32))
# 添加网络信息
# 传入的模型、input_to_model表示输入的变量、verbose表示是否要在控制台打印图形结构
writer.add_graph(model, input_to_model=input, verbose=False)