在django中使用django_debug_toolbar
一、概述
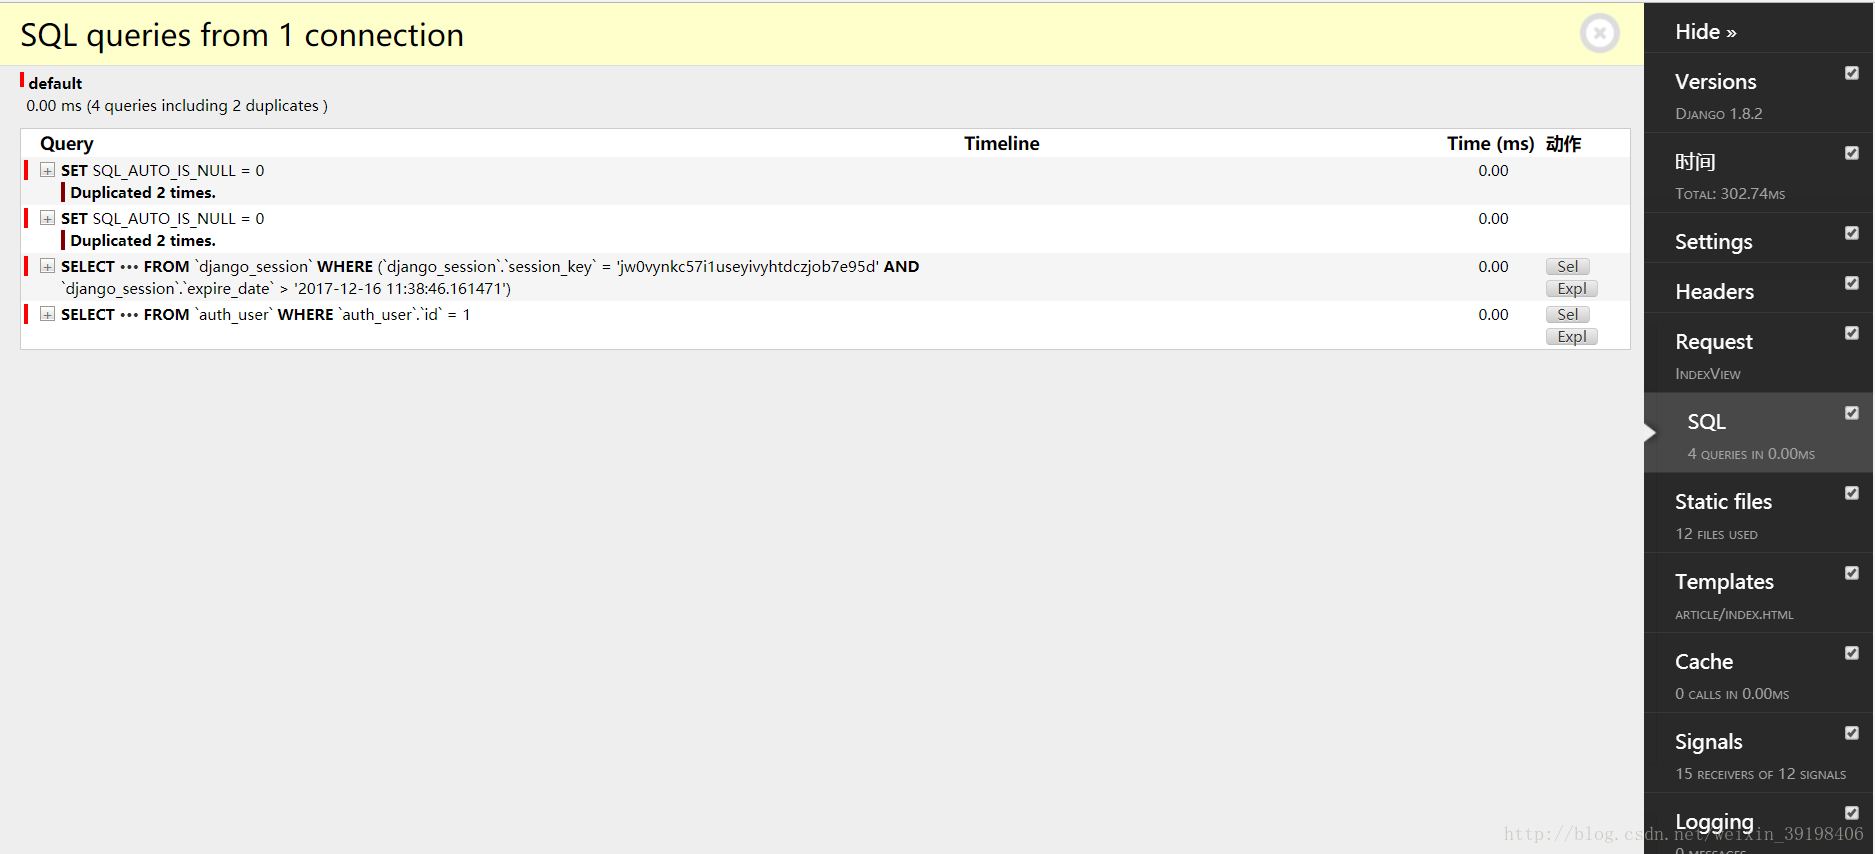
django_debug_toolbar 是django的第三方工具包,给django扩展了调试功能。
包括查看执行的sql语句,db查询次数,request,headers,调试概览等。
二、安装
使用django_debug_toolbar工具先使用pip安装。 pip install django_debug_toolbar,然后修改settings.py和urls.py文件。
三、修改settings文件
1. 显示设置调试工具不要调整settings中的设置
DEBUG_TOOLBAR_PATCH_SETTINGS = False- 1
2. 添加调试工具App
INSTALLED_APPS = INSTALLED_APPS + (
    'debug_toolbar.apps.DebugToolbarConfig',

)- 1
- 2
- 3
- 4
3. 添加调试工具中间件
MIDDLEWARE_CLASSES = MIDDLEWARE_CLASSES + (
    'debug_toolbar.middleware.DebugToolbarMiddleware',
)- 1
- 2
- 3
4. 添加调试工具的IP
INTERNAL_IPS = ("127.0.0.1",)- 1
5. debug_toolbar 组件选项
默认值为如下12个组件,可根据需要自行调整。此处不写代表使用默认值。
DEBUG_TOOLBAR_PANELS = [
    'debug_toolbar.panels.versions.VersionsPanel',
    'debug_toolbar.panels.timer.TimerPanel',
    'debug_toolbar.panels.settings.SettingsPanel',
    'debug_toolbar.panels.headers.HeadersPanel',
'debug_toolbar.panels.request.RequestPanel', 'debug_toolbar.panels.sql.SQLPanel', 'debug_toolbar.panels.staticfiles.StaticFilesPanel', 'debug_toolbar.panels.templates.TemplatesPanel', 'debug_toolbar.panels.cache.CachePanel', 'debug_toolbar.panels.signals.SignalsPanel', 'debug_toolbar.panels.logging.LoggingPanel', 'debug_toolbar.panels.redirects.RedirectsPanel', ]- 1
- 2
- 3
- 4
- 5
- 6
- 7
- 8
- 9
- 10
- 11
- 12
- 13
- 14
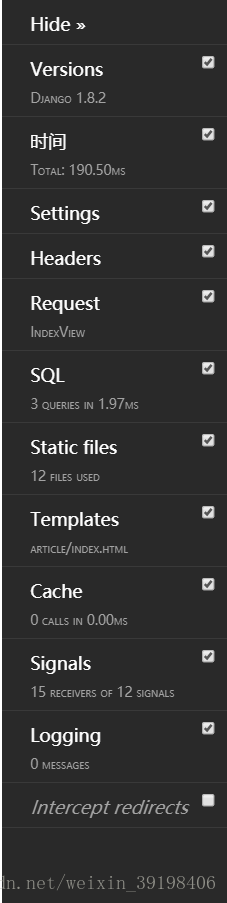
下图显示了所有推荐组件:
6. debug_toolbar 配置项
默认为如下选项,此处不写代表使用默认值,可根据需要自行调整。
备注:'JQUERY_URL': '//cdn.bootcss.com/jquery/2.1.4/jquery.min.js'此项原本为google指向的一个js,改成这样就不会报404了。
CONFIG_DEFAULTS = {
    # Toolbar options
    'DISABLE_PANELS': {'debug_toolbar.panels.redirects.RedirectsPanel'},
'INSERT_BEFORE': '</body>', 'JQUERY_URL': '//cdn.bootcss.com/jquery/2.1.4/jquery.min.js', 'RENDER_PANELS': None, 'RESULTS_CACHE_SIZE': 10, 'ROOT_TAG_EXTRA_ATTRS': '', 'SHOW_COLLAPSED': False, 'SHOW_TOOLBAR_CALLBACK': 'debug_toolbar.middleware.show_toolbar', # Panel options 'EXTRA_SIGNALS': [], 'ENABLE_STACKTRACES': True, 'HIDE_IN_STACKTRACES': ( 'socketserver' if six.PY3 else 'SocketServer', 'threading', 'wsgiref', 'debug_toolbar', 'django', ), 'PROFILER_MAX_DEPTH': 10, 'SHOW_TEMPLATE_CONTEXT': True, 'SKIP_TEMPLATE_PREFIXES': ( 'django/forms/widgets/', 'admin/widgets/', ), 'SQL_WARNING_THRESHOLD': 500, # milliseconds } - 1
- 2
- 3
- 4
- 5
- 6
- 7
- 8
- 9
- 10
- 11
- 12
- 13
- 14
- 15
- 16
- 17
- 18
- 19
- 20
- 21
- 22
- 23
- 24
- 25
- 26
- 27
- 28
- 29
四、修改urls文件
7. debug_toolbar添加到全局url
if settings.DEBUG:
    import debug_toolbar
    urlpatterns += patterns('', url(r'^__debug__/', include(debug_toolbar.urls)),)
五、非默认Panle和第三方Panle
参考:http://django-debug-toolbar.readthedocs.io/en/1.0/panels.html#non-default-built-in-panels
8. 默认面板
# 查看视图函数的信息
debug_toolbar.panels.profiling.ProfilingPanel- 1
- 2
9. 第三方面板
注意,第三方面板没有官方维护!同时,想要使用某个面板,所在的github主页上查看调用和配置方法。
# 查看您的Haystack后端所做的查询
haystack_panel.panel.HaystackDebugPanel
# 验证您的HTML并显示警告和错误
debug_toolbar_htmltidy.panels.HTMLTidyDebugPanel # 使用调试语句检索并显示您指定的信息。Inspector面板也会默认登录到控制台 inspector_panel.panels.inspector.InspectorPanel # 提供了一个profiling panel,它包含了line_profiler的输出 debug_toolbar_line_profiler.panel.ProfilingPanel # 跟踪memcached的使用情况。它目前支持pylibmc和memcache库 memcache_toolbar.panels.memcache.MemcachePanel或memcache_toolbar.panels.pylibmc.PylibmcPanel # 添加MongoDB调试信息 debug_toolbar_mongo.panel.MongoDebugPanel # 在你的django应用程序中跟踪neo4j rest API调用,这也适用于neo4django和neo4jrestclient neo4j_panel.Neo4jPanel # 浏览在django.contrib.sites中注册的网站并在它们之间切换。用于调试使用动态设置的SITE_ID的django-dynamicsites项目。 sites_toolbar.panels.SitesDebugPanel # 显示您的Django应用程序的模板渲染时间 template_timings_panel.panels.TemplateTimings.TemplateTimings # 轻松切换登录用户,查看当前用户的属性 debug_toolbar_user_panel.panels.UserPanel