笔记(1)中利用tensorflow.js完成了机器学习中曲线拟合的任务,这篇笔记将实现一个经典的机器学习问题——CNN识别手写数字集MNIST。参考官方示例Training on Images: Recognizing Handwritten Digits with a Convolutional Neural Network,修改部分代码并用echarts改写vega。
1、定义mnist数据类
import * as tf from '@tensorflow/tfjs';

const IMAGE_SIZE = 784;//图片大小28*28
const NUM_CLASSES = 10;//类别数
const NUM_DATASET_ELEMENTS = 65000;//总样本数
const NUM_TRAIN_ELEMENTS = 55000;//训练样本数
const NUM_TEST_ELEMENTS = NUM_DATASET_ELEMENTS - NUM_TRAIN_ELEMENTS;//测试样本数

const MNIST_IMAGES_SPRITE_PATH = './src/mnist_images.png';//mnist图像
const MNIST_LABELS_PATH = './src/mnist_labels_uint8';//mnist图像对应的类别

export class MnistData {
  constructor() {
    this.shuffledTrainIndex = 0;
    this.shuffledTestIndex = 0;
  }

  async load() {
    const img = new Image();
    const canvas = document.createElement('canvas');
    const ctx = canvas.getContext('2d');
    const imgRequest = new Promise((resolve, reject) => {
      img.crossOrigin = '';
      img.onload = () => {
        img.width = img.naturalWidth;
        img.height = img.naturalHeight;
        const datasetBytesBuffer = new ArrayBuffer(NUM_DATASET_ELEMENTS * IMAGE_SIZE * 4);
        const chunkSize = 5000;
        canvas.width = img.width;
        canvas.height = chunkSize;

        for (let i = 0; i < NUM_DATASET_ELEMENTS / chunkSize; i++) {
          const datasetBytesView = new Float32Array(
            datasetBytesBuffer,
            i * IMAGE_SIZE * chunkSize * 4,
            IMAGE_SIZE * chunkSize
          );
          ctx.drawImage(img, 0, i * chunkSize, img.width, chunkSize, 0, 0, img.width, chunkSize);

          const imageData = ctx.getImageData(0, 0, canvas.width, canvas.height);

          for (let j = 0; j < imageData.data.length / 4; j++) {
            datasetBytesView[j] = imageData.data[j * 4] / 255;
          }
        }
        this.datasetImages = new Float32Array(datasetBytesBuffer);

        resolve();
      };
      img.src = MNIST_IMAGES_SPRITE_PATH;
    });

    const labelsRequest = fetch(MNIST_LABELS_PATH);
    const [imgResponse, labelsResponse] = await Promise.all([imgRequest, labelsRequest]);

    this.datasetLabels = new Uint8Array(await labelsResponse.arrayBuffer());

    this.trainIndices = tf.util.createShuffledIndices(NUM_TRAIN_ELEMENTS);
    this.testIndices = tf.util.createShuffledIndices(NUM_TEST_ELEMENTS);

    this.trainImages = this.datasetImages.slice(0, IMAGE_SIZE * NUM_TRAIN_ELEMENTS);
    this.testImages = this.datasetImages.slice(IMAGE_SIZE * NUM_TRAIN_ELEMENTS);
    this.trainLabels = this.datasetLabels.slice(0, NUM_CLASSES * NUM_TRAIN_ELEMENTS);
    this.testLabels = this.datasetLabels.slice(NUM_CLASSES * NUM_TRAIN_ELEMENTS);
  }

  nextTrainBatch(batchSize) {
    return this.nextBatch(
      batchSize,
      [this.trainImages, this.trainLabels],
      () => {
        this.shuffledTrainIndex = (this.shuffledTrainIndex + 1) % this.trainIndices.length;
        return this.trainIndices[this.shuffledTrainIndex];
      }
    );
  }

  nextTestBatch(batchSize) {
    return this.nextBatch(
      batchSize,
      [this.testImages, this.testLabels],
      () => {
        this.shuffledTestIndex = (this.shuffledTestIndex + 1) % this.testIndices.length;
        return this.testIndices[this.shuffledTestIndex];
      }
    );
  }

  nextBatch(batchSize, data, index) {
    const batchImagesArray = new Float32Array(batchSize * IMAGE_SIZE);
    const batchLabelsArray = new Uint8Array(batchSize * NUM_CLASSES);

    for (let i = 0; i < batchSize; i++) {
      const idx = index();
      const image = data[0].slice(idx * IMAGE_SIZE, idx * IMAGE_SIZE + IMAGE_SIZE);
      batchImagesArray.set(image, i * IMAGE_SIZE);
      const label = data[1].slice(idx * NUM_CLASSES, idx * NUM_CLASSES + NUM_CLASSES);
      batchLabelsArray.set(label, i * NUM_CLASSES);
    }

    const xs = tf.tensor2d(batchImagesArray, [batchSize, IMAGE_SIZE]);
    const labels = tf.tensor2d(batchLabelsArray, [batchSize, NUM_CLASSES]);

    return {xs, labels};
  }
}
mnist数据类在构造器内声明两个index,分别是训练过程的洗牌index和测试过程的洗牌index。引入洗牌index是为了防止模型训练受到传入图像顺序的影响。假设不洗牌,先将所有1的图像传入模型进行训练,那么此时训练的模型将学会预测1的手写体;之后传入所有2的图像,则模型将切换到仅预测2(这样会最小化损失函数);则这样永远无法完整的对全部数据集进行预测。
之后定义方法load(),该方法将图片mnist_images.png进行切割,并从mnist_labels_uint8中找到对应的label。之后的nextTrainBatch和nextTestBatch将分别返回训练样本和测试样本。
2、CNN的构建
import * as tf from '@tensorflow/tfjs';
import {MnistData} from './data';
import * as ui from './ui';

const model = tf.sequential();
model.add(tf.layers.conv2d({
  inputShape: [28, 28, 1],
  kernelSize: 5,
  filters: 8,
  strides: 1,
  activation: 'relu',
  kernelInitializer: 'varianceScaling'
}));
model.add(tf.layers.maxPooling2d({
  poolSize: [2, 2],
  strides: [2, 2]
}));
model.add(tf.layers.conv2d({
  kernelSize: 5,
  filters: 16,
  strides: 1,
  activation: 'relu',
  kernelInitializer: 'varianceScaling'
}));
model.add(tf.layers.maxPooling2d({
  poolSize: [2, 2],
  strides: [2, 2]
}));
model.add(tf.layers.flatten());
model.add(tf.layers.dense({
  units: 10,
  kernelInitializer: 'varianceScaling',
  activation: 'softmax'
}));

const LEARNING_RATE = 0.15;
const optimizer = tf.train.sgd(LEARNING_RATE);
model.compile({
  optimizer: optimizer,
  loss: 'categoricalCrossentropy',
  metrics: ['accuracy']
});
首先定义模型为tf.sequential(),该模型中张量将连续地从一层传递到下一层。之后分别加入卷积层、池化层、卷积层、池化层、flatten层(将输入展为向量)和dense层(完全连接层)。
其中卷积层是2维卷积;inputShape是传入数据的维数(第二个卷积层可以不指定inputShape,tf将从前一层的输出推断该值),三个值分别为行、列、深度,mnist图像格式为28*28像素点,深度为1,因为只有一个颜色通道;kernelSize是应用到输入数据上的滑动滤波器窗口的大小,5代表5*5矩形卷积窗口;filters指滤波器窗口的数量,8代表有8个滤波器;strides指滑动窗口的步长,1代表每次将以1像素为单位滑动滤波器;activation为激活函数,relu代表线性整流函数,函数形状如下所示;kernelInitializer用于随机初始化模型权重,这里使用VarianceScaling方法初始化模型。

池化层使用的是二维最大池,通过计算该层每个滑动窗口的最大值来降低纬度。其中poolSize是滑动窗口的大小,[2, 2]代表2*2的矩形窗口;strides代表滑动窗口移动的步长,[2, 2]代表窗口将在水平和垂直方向是以2像素为单位进行移动。
flatten层将上一层的输出平铺到一个矢量上。dense层(完全连接层)将执行最终的分类任务。其中units是输出的激活数,10代表将有10种不同的输出,满足mnist的10种分类(数字0-9);kernelInitializer设为VarianceScaling初始化方法;分类任务的最后一层激活函数activation通常设为softmax,该函数将10维输出向量归一化为概率分布,以便我们知道该样本属于10个类中每个类的概率。
定义学习率为0.15,优化器为随机梯度下降法(SGD);损失函数为categoricalCrossentropy,即分类任务的交叉熵;评价指标为准确率accuracy,即所有预测中正确预测的百分比。之后编译模型。
3、模型训练
const BATCH_SIZE = 64;
const TRAIN_BATCHES = 150;
const TEST_BATCH_SIZE = 1000;
const TEST_ITERATION_FREQUENCY = 5;

async function train() {
  ui.isTraining();

  const lossValues = [];
  const accuracyValues = [];

  for (let i = 0; i < TRAIN_BATCHES; i++) {
    const batch = data.nextTrainBatch(BATCH_SIZE);

    let testBatch;
    let validationData;
    if (i % TEST_ITERATION_FREQUENCY === 0) {
      testBatch = data.nextTestBatch(TEST_BATCH_SIZE);
      validationData = [
        testBatch.xs.reshape([TEST_BATCH_SIZE, 28, 28, 1]), testBatch.labels
      ];
    }

    const history = await model.fit(
      batch.xs.reshape([BATCH_SIZE, 28, 28, 1]),
      batch.labels,
      {batchSize: BATCH_SIZE, validationData, epochs: 1}
    );
    const loss = history.history.loss[0];
    const accuracy = history.history.acc[0];
    lossValues.push([i, loss]);

    if (testBatch != null) {
      accuracyValues.push([i, accuracy]);
    }

    batch.xs.dispose();
    batch.labels.dispose();
    if (testBatch != null) {
      testBatch.xs.dispose();
      testBatch.labels.dispose();
    }

    await tf.nextFrame();
  }
  ui.plot(lossValues, accuracyValues);
}

async function showPredictions() {
  const testExamples = 100;
  const batch = data.nextTestBatch(testExamples);

  tf.tidy(() => {
    const output = model.predict(batch.xs.reshape([-1, 28, 28, 1]));

    const axis = 1;
    const labels = Array.from(batch.labels.argMax(axis).dataSync());
    const predictions = Array.from(output.argMax(axis).dataSync());

    ui.showTestResults(batch, predictions, labels);
  });
}

let data;
async function load() {
  data = new MnistData();
  await data.load();
}

async function mnist() {
  await load();

  await train();

  showPredictions();
}


mnist();
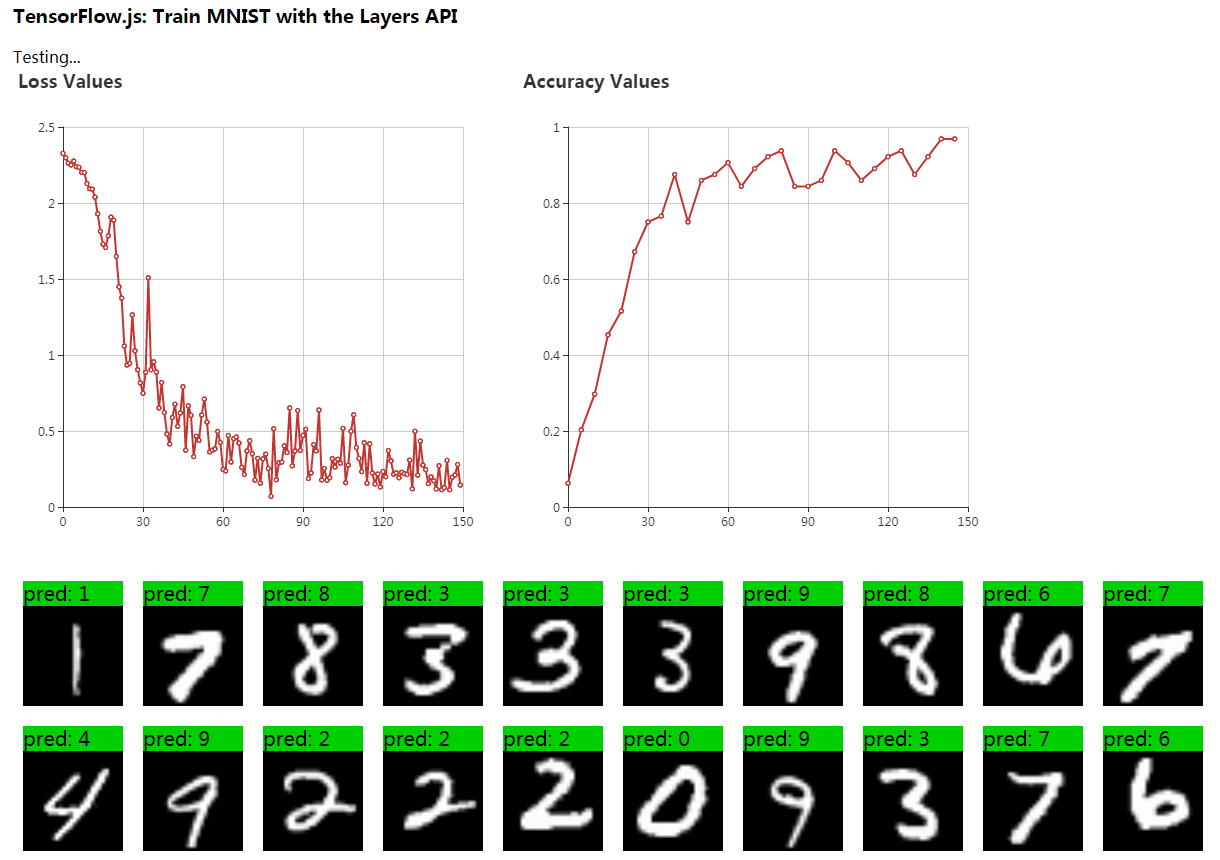
训练时首先调用ui.isTraining()将training输出到文档,之后进行TEST_BATCH_SIZE = 1000轮迭代,每次记录损失函数的值及准确率,并在训练结束后进行可视化展示。之后调用showPredictions方法将测试样本的预测值与实际像素图输出到文档。
4、可视化部分
const echarts = require('echarts');

const statusElement = document.getElementById('status');
const imagesElement = document.getElementById('images');

export function isTraining() {
  statusElement.innerText = 'Training...';
}

export function showTestResults(batch, predictions, labels) {
  statusElement.innerText = 'Testing...';

  const testExamples = batch.xs.shape[0];
  let totalCorrect = 0;
  for (let i = 0; i < testExamples; i++) {
    const image = batch.xs.slice([i, 0], [1, batch.xs.shape[1]]);

    const div = document.createElement('div');
    div.className = 'pred-container';

    const canvas = document.createElement('canvas');
    canvas.className = 'prediction-canvas';
    draw(image.flatten(), canvas);

    const pred = document.createElement('div');

    const prediction = predictions[i];
    const label = labels[i];
    const correct = prediction === label;

    pred.className = `pred ${(correct ? 'pred-correct' : 'pred-incorrect')}`;
    pred.innerText = `pred: ${prediction}`;

    div.appendChild(pred);
    div.appendChild(canvas);

    imagesElement.appendChild(div);
  }
}

const lossChart = echarts.init(document.getElementById('lossChart'));
const accuracyChart = echarts.init(document.getElementById('accuracyChart'));
export function plot(lossValues, accuracyValues) {
  lossChart.setOption({
    title: {
      text: 'Loss Values'
    },
    xAxis: {
      type: 'value'
    },
    yAxis: {
      type: 'value'
    },
    series: [{
      name: 'loss',
      type: 'line',
      data: lossValues
    }]
  });
  accuracyChart.setOption({
    title: {
      text: 'Accuracy Values'
    },
    xAxis: {
      type: 'value'
    },
    yAxis: {
      type: 'value'
    },
    series: [{
      name: 'accuracy',
      type: 'line',
      data: accuracyValues
    }]
  });
}

export function draw(image, canvas) {
  const [width, height] = [28, 28];
  canvas.width = width;
  canvas.height = height;
  const ctx = canvas.getContext('2d');
  const imageData = new ImageData(width, height);
  const data = image.dataSync();
  for (let i = 0; i < height * width; ++i) {
    const j = i * 4;
    imageData.data[j + 0] = data[i] * 255;
    imageData.data[j + 1] = data[i] * 255;
    imageData.data[j + 2] = data[i] * 255;
    imageData.data[j + 3] = 255;
  }
  ctx.putImageData(imageData, 0, 0);
}
BUG1:
  lossChart.setOption({
    series: [{
      name: 'loss',
      type: 'line',
      data: lossValues
    }]
  });
当绘图时仅传入series参数时,Echarts报错:
Uncaught (in promise) TypeError: Cannot read property 'get' of undefined
此时将xAxis、yAxis等添加进options中即可。
  lossChart.setOption({
    title: {
      text: 'Loss Values'
    },
    xAxis: {
      type: 'value'
    },
    yAxis: {
      type: 'value'
    },
    series: [{
      name: 'loss',
      type: 'line',
      data: lossValues
    }]
  });
BUG2:

报错 Uncaught Error: Unsupported core optimizer type: t
原因是相关依赖未正确安装,cd到package.json同目录,运行yarn命令安装相关包。
完整程序见我的github,具体步骤为:
step1 新建文件夹,cmd输入git clone [email protected]:orangecsy/tfjs-exercise.git,cd 2进入文件夹2;
step2 cmd输入webpack,打包;
step3 cd dist进入dist文件夹,cmd中输入http-server(需先npm install http-server)或使用webpack配置开发服务器;
step4 浏览器中输入http://127.0.0.1:8080/,即为结果。