公司项目使用的是在html中使用vue
基础代码
<!DOCTYPE html>
<html lang="en">

<head>
  <meta charset="UTF-8">
  <meta
    http-equiv="X-UA-Compatible"
    content="IE=edge"
  >
  <meta
    name="viewport"
    content="width=device-width, initial-scale=1.0"
  >
  <title>html中使用vue</title>
  <!-- 开发环境版本,包含了有帮助的命令行警告 -->
  <script src="https://cdn.jsdelivr.net/npm/vue@2/dist/vue.js"></script>
  <!-- 或者生产环境版本,优化了尺寸和速度 -->
  <!-- <script src="https://cdn.jsdelivr.net/npm/vue@2"></script> -->
  <script src="https://map.qq.com/api/gljs?v=1.exp&key=PBTBZ-Y44LR-RHTWK-W5QWJ-MRE4J-COBPZ"></script>
  <style>
    #app {


      width: 400px;
      padding: 20px;
      border: 1px solid rgb(243, 191, 191);
    }
  </style>
</head>

<body>
  <div id="app">
    <!-- 地图容器 -->
    <div class="map" id="map"></div>
  </div>
  <script>
    // 创建一个 Vue 实例:每个 Vue 应用都是通过用 `Vue` 函数创建一个新的 **Vue 实例**开始的:
    var app = new Vue({


      el: '#app',
      data: {


        map:null,
        markerLayer:null,  // 标记点
        polylineLayer:null, // 轨迹
      },
      created(){


      	this.showMap()
      }
    })
  </script>
</body>

</html>
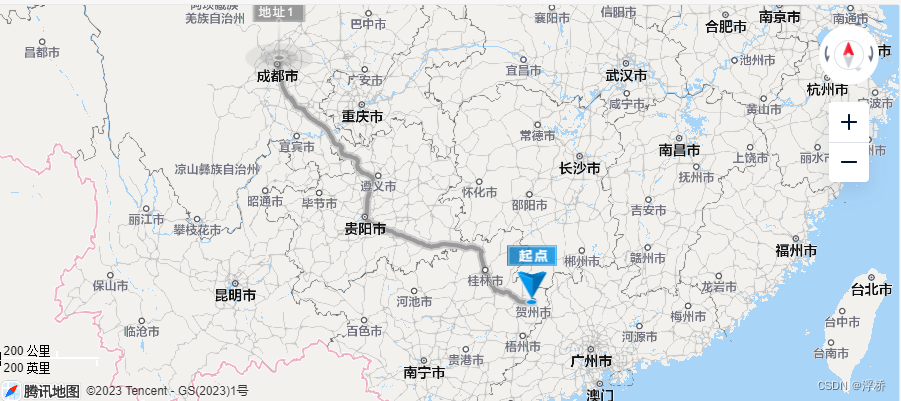
需求:实现腾讯标记点和规划路线
vue中使用腾讯地图:
1、初始化地图
showMap (){


    if (this.map) {


        this.map.destroy();
    }
    this.map = new TMap.Map("map", {


        zoom: 12,//设置地图缩放级别
    });
    // 设置轨迹线样式
    this.polylineLayer = new TMap.MultiPolyline({


        map: this.map, // 绘制到目标地图
        // 折线样式定义
        styles: {


            style_history: new TMap.PolylineStyle({


                color: '#00B265', // 线填充色
                width: 4, // 折线宽度
                borderWidth: 2, // 边线宽度
                borderColor: '#98EAC7', // 边线颜色
                lineCap: 'round', // 线端头方式
                eraseColor: 'rgba(190,188,188,1)',
            }),
            style_plan: new TMap.PolylineStyle({


                color: '#999', //线填充色
                width: 4, //折线宽度
                borderWidth: 2, //边线宽度
                borderColor: '#ccc', //边线颜色
                borderStyle:'dashed',
                lineCap: 'round', //线端头方式
            })
        }
    })
    // 设置标记点样式
    this.markerLayer = new TMap.MultiMarker({


        map: this.map,  //指定地图容器
        //样式定义
        styles: {


            //创建一个styleId为"..."的样式(styles的子属性名即为styleId)
            "wc": new TMap.MarkerStyle({


                width: 68,  // 点标记样式宽度(像素)
                height: 73, // 点标记样式高度(像素)
                src: '../images/wc.png',  //图片路径
                anchor: {

     x: 36, y: 60 },
                offset: {

     x: -3, y: -16 },
                color:'#fff'
            }),
            "no": new TMap.MarkerStyle({


                width: 68,
                height: 73,
                src: '../images/no.png',
                anchor: {

     x: 36, y: 60 },
                offset: {

     x: -3, y: -24 },
                color:'#fff'
            }),
            "car": new TMap.MarkerStyle({


                width: 40,
                height: 32,
                src: '../images/car.png',
                anchor: {

     x: 26, y: 20 },
                color:'#fff'
            }),
            "startStyle": new TMap.MarkerStyle({


                "width": 50,
                "height": 60,
                "src": '../images/start.png',
                "anchor": {

     x: 26, y: 56 }
            })
        }
    });
}
2、标记点
1、添加
this.markerLayer.add([
    {


        styleId:"startStyle",  // 绑定样式名
        id: "Start", // 标记点唯一标识,删除时使用
        content:'', // 标记点内容
        position: new TMap.LatLng(40.765540, 116.987389)  // 标记点位置
    },
    {


        styleId:"car",  // 绑定样式名
        id: "car", // 标记点唯一标识,删除时使用
        content:'车', // 标记点内容
        position: new TMap.LatLng(40.438540, 116.472389)  // 标记点位置
    },
    {


        styleId:"no",  // 绑定样式名
        id: "no2", // 标记点唯一标识,删除时使用
        content:'地址1', // 标记点内容
        position: new TMap.LatLng(40.438540, 116.872389)  // 标记点位置
    },
    {


        styleId:"no",  // 绑定样式名
        id: "no2", // 标记点唯一标识,删除时使用
        content:'地址2', // 标记点内容
        position: new TMap.LatLng(40.938540, 116.272389)  // 标记点位置
    },
    ...
])
2、修改
// 修改id为no2的点标记的位置,如果不存在会作为新的点标注添加到markerLayer中
this.markerLayer.updateGeometries([
    {


     "styleId":"no",
     "id": "no2",
     "position": new TMap.LatLng(39.994104, 116.287503),
    }
])
3、删除
this.markerLayer.remove(['Start','car','no1','no2'])  // 删除对呀id的标记点
this.markerLayer.remove([]) // 传入空数组表示为清空标记点
3、轨迹线
1、添加
let pash = [
    new TMap.LatLng(40.038540, 116.272389),
    new TMap.LatLng(40.038844, 116.275210),
    new TMap.LatLng(40.041407, 116.274738)
]

this.polylineLayer.add({


    'id': 'plan',//折线唯一标识,删除时使用
    'styleId': 'style_plan',// 绑定样式名
    'paths': pash   // 轨迹点
})
2、删除
this.polylineLayer.remove("plan")
4、规划路线
let start = '39.984039,116.307630' // 起点坐标
let end = '39.977263,116.337063'  // 终点坐标
let waypoints = '39.986039,116.308630;39.989039,116.307930;39.994039,116.317630'  // 途经点

let url = 'https://apis.map.qq.com/ws/direction/v1/driving/'
url += '?from=' + start
url += '&to=' + end
url += '&output=jsonp&callback=cb'  // 指定JSONP回调函数名,本例为cb
url += '&waypoints='+waypoints.join(';')

var script=document.createElement('script');
script.src = mapUrl;
document.body.appendChild(script);
<script>
   function cb(ret){


        if(ret.status!==0){


            return
        }
        var coors = ret.result.routes[0].polyline;
        //坐标解压(返回的点串坐标,通过前向差分进行压缩,因此需要解压)
        var kr = 1000000;
        for (var i = 2; i < coors.length; i++) {


            coors[i] = Number(coors[i - 2]) + Number(coors[i]) / kr;
        }
        myVue.displayPolyline(coors) // 显示路线  myVue:vue实例(这里是html文件中使用vue,在创建vue时保存 let myVue = new Vue({})),改方法放到<script>标签里,不放到vue生命周期里)
    }
</script>
			// 画规划的路线
            displayPolyline(coors){


                let pl = []
                //将解压后的坐标生成LatLng数组
                for (var i = 0; i < coors.length; i += 2) {


                    pl.push(new TMap.LatLng(coors[i], coors[i+1]));
                }

                this.polylineLayer.add({


                    'id': 'plan',//折线唯一标识,删除时使用
                    'styleId': 'style_plan',//绑定样式名
                    'paths': pl
                })

                //创建LatLngBounds实例
                var latlngBounds = new TMap.LatLngBounds();
                //将坐标逐一做为参数传入extend方法,latlngBounds会根据传入坐标自动扩展生成
                for(var i = 0;i<pl.length; i++){


                    latlngBounds.extend(pl[i]);
                }
                //调用fitBounds自动调整地图显示范围
                this.map.fitBounds(latlngBounds);
            },