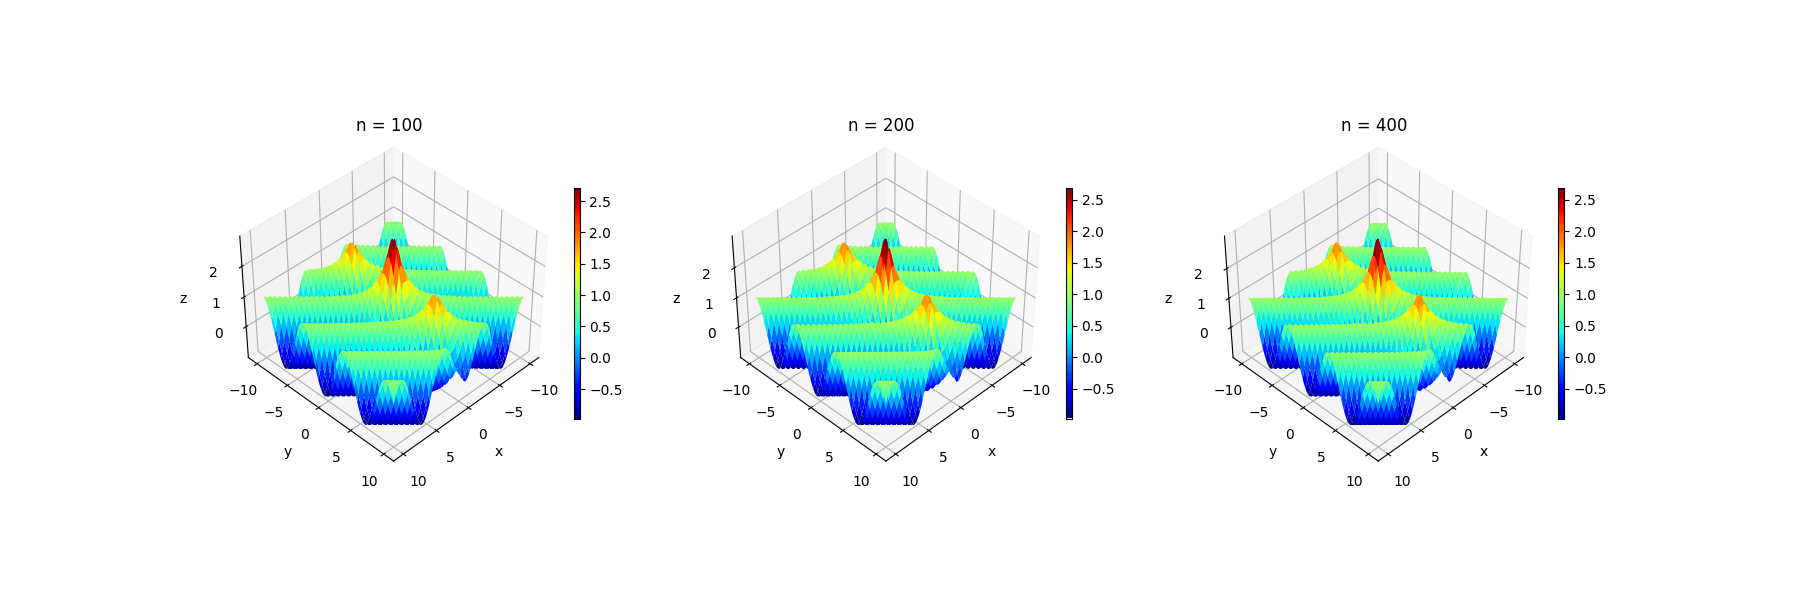
三维组合平面
关键点:
- 要先设置一块比例合适的底板 fig = plt.figure(figsize=(18, 6))
- 在底板上设置幕布 ax = fig.add_subplot(1,3,idx+1,projection=‘3d’) # 设置三块3D幕布,
- 幕布的位置和大小是根据底板来确定的,我这里设置的就是将底板空间分成一行 三列 画其中的第idx+1块,而且幕布是分为不同类型的,画三维图就用3D的幕布。
%matplotlib inline
import matplotlib
import matplotlib.pyplot as plt
import numpy as np

def out(n):
    x = np.linspace(-10, 10, n)
    y = np.linspace(-10, 10, n)
    X,Y = np.meshgrid(x,y)
    Z = np.e**(-abs(X)) + np.cos(X+Y) + 1/(X**2+Y**2+1)
    return X, Y, Z

fig = plt.figure(figsize=(18, 6)) # 设置一块3:1的底板
for idx, n in enumerate([100,200,400]):
    # #显示三维图
    ax = fig.add_subplot(1,3,idx+1,projection='3d') # 设置三块3D幕布,(一行 三列 第idx+1块)
    plt.title(f"n = {

      n}") # 设置每一块幕布的标题
    X, Y, Z = out(n)
    surf = ax.plot_surface(X,Y,Z,cmap='jet') # 将数据传入到幕布中,显示曲面图
    # ax.contour3D(X,Y,Z,50,cmap='jet') # 显示等高线图
    ax.set_xlabel('x') # 设置x轴名字
    ax.set_ylabel('y')
    ax.set_zlabel('z')
    ax.view_init(40, 45) # 调整俯仰角
    fig.colorbar(surf, shrink=0.5, aspect=40) # 显示颜色条
fig.savefig('./sanwei.png') # 保存
plt.show()
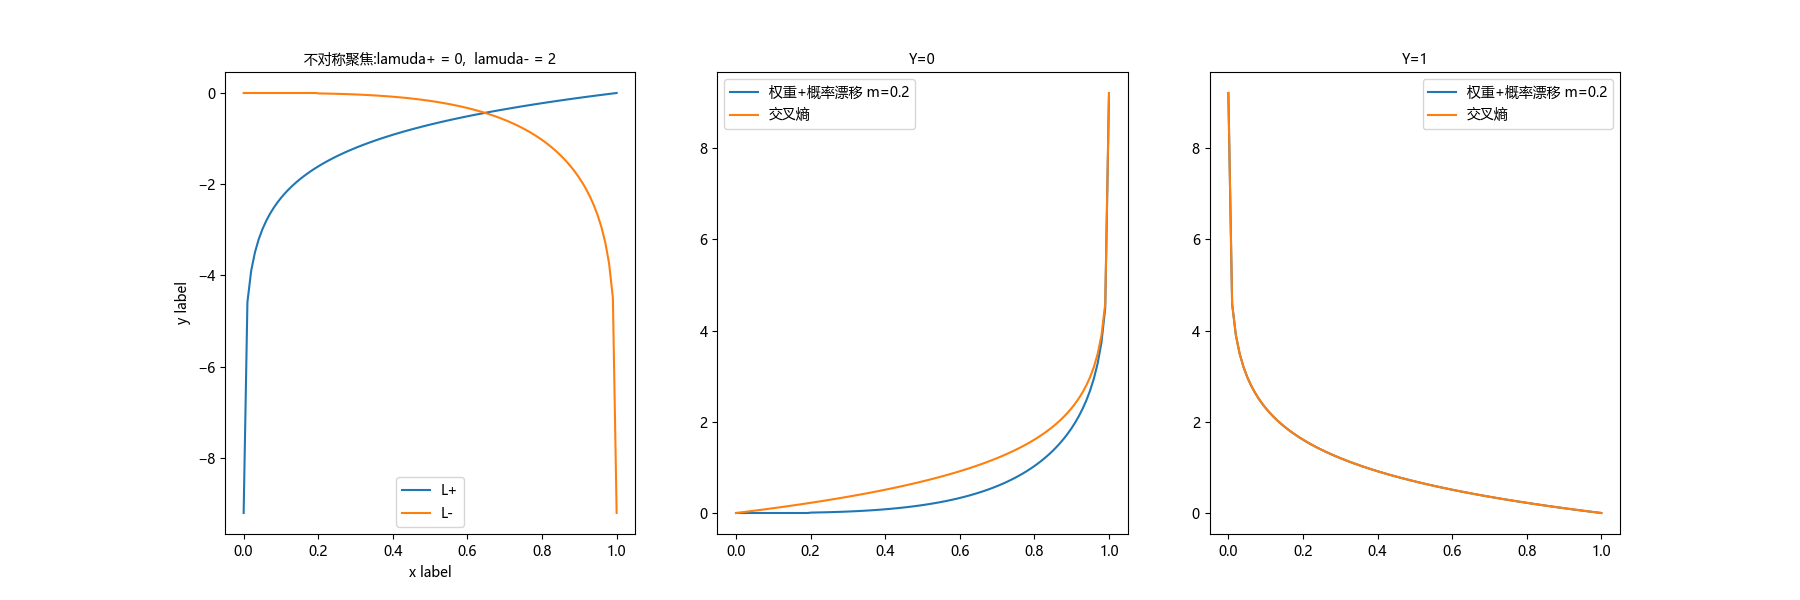
二维组合平面
绘制二维组合平面要注意:幕布要使用二维的平面幕布 ----> plt.subplot(1,3,1) # 一行三列中的第一列
matplotlib.rc("font",family='Microsoft YaHei')  # 将字体设置为雅黑
# 使用pyplot函数绘图
lamuda1 = 0
lamuda2 = 2
Y = 0
m = 0.2
p = np.linspace(0.0001, 0.9999, 100)
p_m = p.copy()
p_m[(p-m)<0] = 0  # p_m = np.max((p-m),0)
L1 = (1-p)**lamuda1 * np.log(p)
L2 = p_m**lamuda2 * np.log(1-p_m)
L = -Y*L1 - (1-Y)*L2
B_CrossEntropy = -(Y*np.log(p) + (1-Y)*np.log(1-p))


plt.figure(figsize=(18, 6))
# 绘制图1
plt.subplot(1,3,1) # 设置幕布 一行两列中的第一列
plt.title(f'不对称聚焦:lamuda+ = {

      lamuda1},  lamuda- = {

      lamuda2}') # 使用中文时要设置字体
plt.plot(p, L1, label='L+')
plt.plot(p, L2, label='L-')
# 设置x,y轴的标签
plt.xlabel('x label')
plt.ylabel('y label')
plt.legend() # 设置标签的位置

# 绘制图2
plt.subplot(1,3,2) # 设置幕布
plt.plot(p, L, label=f'权重+概率漂移 m={

      m}')
plt.plot(p, B_CrossEntropy, label='交叉熵')
plt.title('Y=0')# 设置标签
plt.legend()# 设置标签的位置

# 绘制图3
Y = 1
L = -Y*L1 - (1-Y)*L2
B_CrossEntropy = -(Y*np.log(p) + (1-Y)*np.log(1-p))
plt.subplot(1,3,3) # 设置幕布 一行两列中的第一列
plt.plot(p, L, label=f'权重+概率漂移 m={

      m}')
plt.plot(p, B_CrossEntropy, label='交叉熵')
plt.title('Y=1')# 设置标签
plt.legend()# 设置标签的位置
plt.savefig('./erwei.png') # 保存
plt.show()