版权声明:本文为博主ouening原创文章,未经博主允许不得恶意复制转载,需要注明出处,尊重知识成果!技术交流请联系[email protected]! https://blog.csdn.net/ouening/article/details/84175396
之前写过一篇关于绘制雨点动图的博客
Python/Matplotlib实现雨点图动画
博客中使用了matplotlib的animation模块,使用比较繁琐,下面介绍一种比较简单的办法,使用交互式绘图和暂停功能实现,直接看下面代码:
import numpy as np
import matplotlib.pyplot as plt
from matplotlib import font_manager
# 解决中文乱码问题
myfont = font_manager.FontProperties(fname=r"C:\Windows\Fonts\msyh.ttc"
, size=14)
N = 20
plt.close() # 关闭打开的图形窗口
def anni():
fig = plt.figure()
plt.ion() # 打开交互式绘图interactive
for i in range(N):
plt.cla() # 清除原有图像
plt.xlim(-0.2,20.4) # 设置x轴坐标范围
plt.ylim(-1.2,1.2) # 设置y轴坐标范围
# 每当i增加的时候,增加自变量x的区间长度,可以理解为不断叠加绘图,所以每次循环之前都使用plt.cla()命令清除原有图像
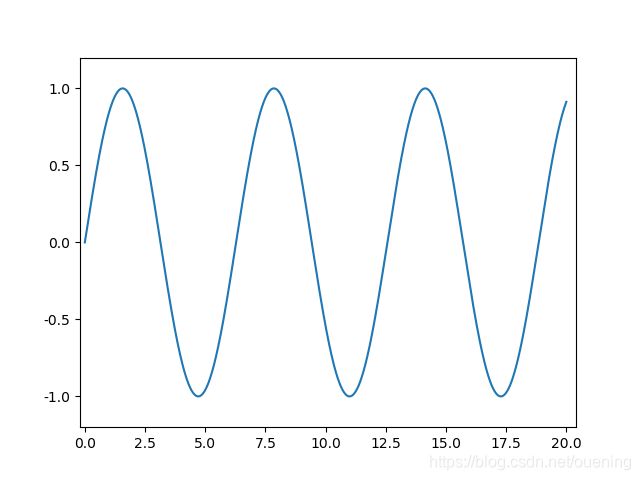
x = np.linspace(0,i+1,1000)
y = np.sin(x)
plt.plot(x,y)
plt.pause(0.1)
# plt.ioff() #关闭交互式绘图
plt.show()
anni()
运行代码后就能看到动图效果了
使用annimation模块的方法如下:
import numpy as np
import matplotlib.pyplot as pl
import matplotlib.animation as animation

x = np.linspace(0, 10, 100)
y = np.sin(x)

fig, ax = plt.subplots()
line, = ax.plot(x, y, color='k')

def update(num, x, y, line):
    line.set_data(x[:num], y[:num])
    line.axes.axis([0, 10, -1, 1])
    return line,

ani = animation.FuncAnimation(fig, update, len(x), fargs=[x, y, line],
                              interval=25, blit=False)
# ani.save('test.gif')
plt.show()
参考链接
[1]https://zhuanlan.zhihu.com/p/31323002
[2]https://stackoverflow.com/questions/28074461/animating-growing-line-plot-in-python-matplotlib
[3]https://matplotlib.org/api/_as_gen/matplotlib.animation.FuncAnimation.html#matplotlib.animation.FuncAnimation