数字图像处理
1. 简述并举例说明彩色增强技术的分类
伪彩色增强
由于人类对颜色的识别能力远强于灰度识别,需要将灰度图像按照线性映射成不同的彩色提高人对图像的识别能力,并提高图片的可视度
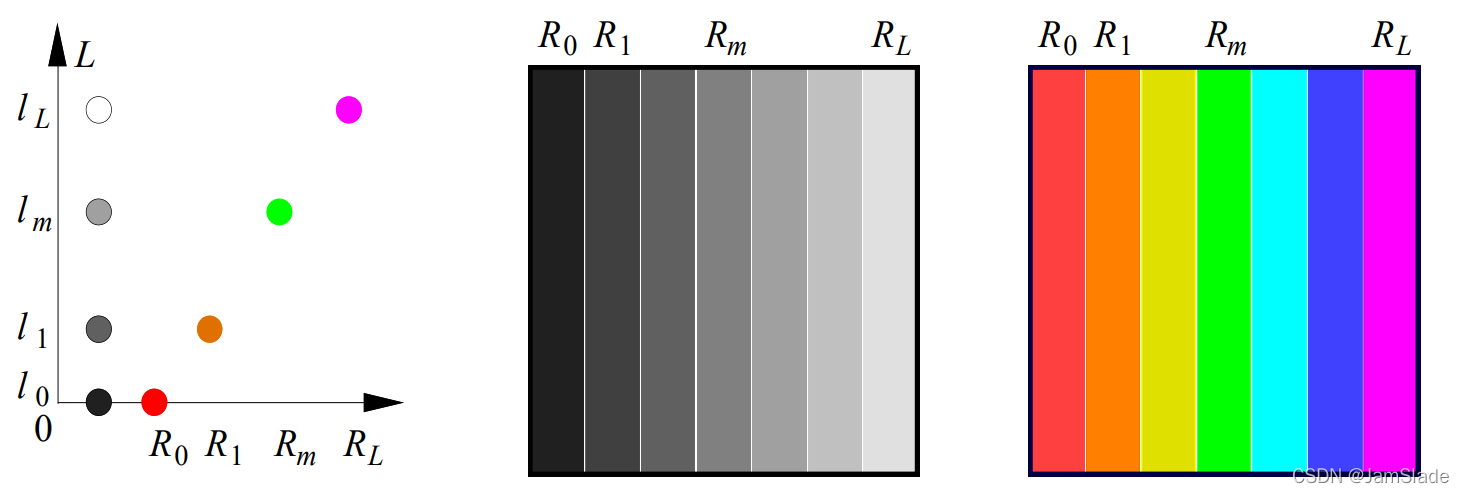
亮度切割
-
基本思路:将图像灰度分级,然后对每个灰度值区间内的像素赋一种颜色。
-
具体操作:平行于图像坐标平面的平面去切割图像亮度函数,从而把亮度函数分成2个灰度值区间
f ( x , y ) = { c m + 1 f ( x , y ) > l m c m f ( x , y ) < l m f(x,y)=\left\{ \begin{array}{l}c_{m+1}&f(x,y) > l_m\\c_{m}& f(x,y) < l_m\end{array}\right. f(x,y)={ cm+1cmf(x,y)>lmf(x,y)<lm
于是在这个切割下,每个区间对应一个颜色
-
还可以将一个区间对应三个函数R(x,y),B(x,y),G(x,y)最后组合成其他颜色
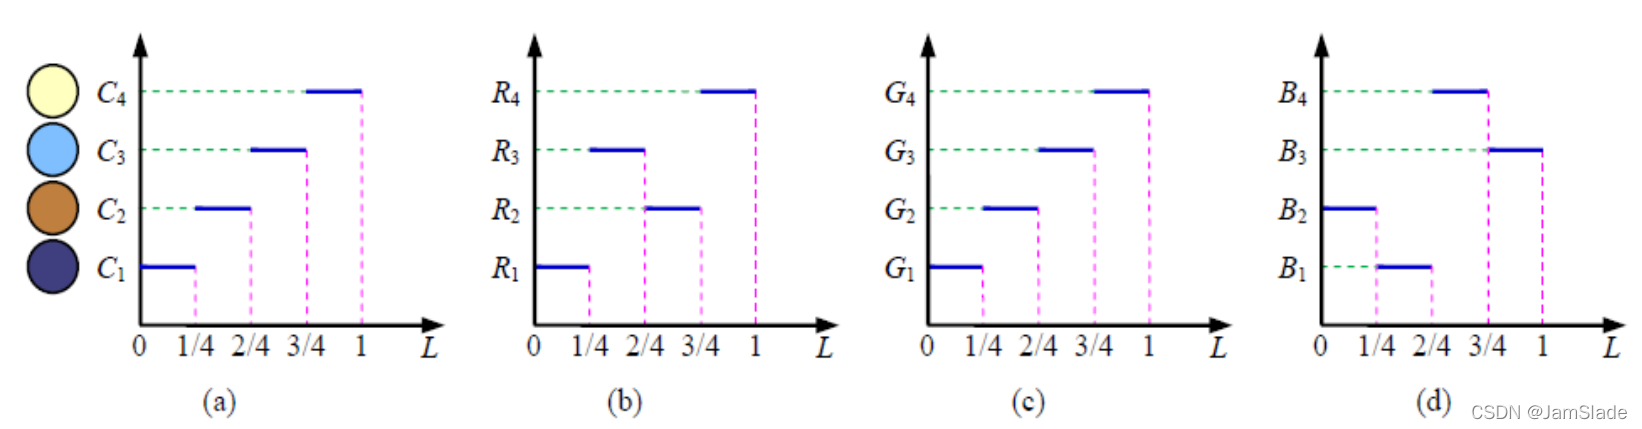
利用变换函数
- 基本思路:亮度切割的加强版——把区间变成了1
- 具体操作:将每个离散点对应三个函数R(x,y),B(x,y),G(x,y)最后组合成其他颜色
本质上就是亮度切割的推广
频域滤波
- 基本思路:对原来灰度图像中的不同频率分量赋予不同的彩色
- 可以利用的方法:低通、带组、带通、高通滤波器
- f(x,y)----傅里叶变换----> 滤波器1 —傅里叶反变换—>得到一个颜色----->彩色
真彩色增强
将一幅彩色图像看作三幅分量图像的组合体,先分别单独处理,再将结果合成将一幅彩色图像中的每个像素看作具有三个属性值,即属性现在为一个矢量,利用对矢量的表达方法进行处理。
根据上述两种策略进行处理的结果有可能相同也有可能不同,主要取决于处理操作的特性。
如果要求两种处理结果相同的话,对处理方法与对象有要求:
1)可同时用于标量和矢量
2)对每个分量的处理要和其他分量独立
邻域平均
C v ( x , y ) = 1 n 2 ∑ ( s , t ) ∈ N ( x , y ) R ( s , t ) C_v(x,y)=\frac{1}{n^2}\sum_{(s,t)\in N(x,y)}R(s,t) Cv(x,y)=n21(s,t)∈N(x,y)∑R(s,t)
C s ( x , y ) = [ 1 n 2 ∑ ( s , t ) ∈ N ( x , y ) R ( s , t ) 1 n 2 ∑ ( s , t ) ∈ N ( x , y ) B ( s , t ) 1 n 2 ∑ ( s , t ) ∈ N ( x , y ) G ( s , t ) ] C_s(x,y)=\left[\begin{array}{l}\frac{1}{n^2} \sum\limits_{(s,t)\in N(x,y)}R(s,t)\\ \frac{1}{n^2} \sum\limits_{(s,t)\in N(x,y)}B(s,t) \\\frac{1}{n^2} \sum\limits_{(s,t)\in N(x,y)}G(s,t) \end{array}\\ \right] Cs(x,y)=⎣⎢⎢⎢⎢⎡n21(s,t)∈N(x,y)∑R(s,t)n21(s,t)∈N(x,y)∑B(s,t)n21(s,t)∈N(x,y)∑G(s,t)⎦⎥⎥⎥⎥⎤
单分量变换增强
-
选择合适的彩色空间对单分量进行增强步骤:
- 将R,G,B分量图转化为H,S,I分量图
- 利用对灰度图增强的方法增强其中的某个分量图
- 再将结果转换为R,G,B分量图。
g i ( x , y ) = T i [ f i ( x , y ) ] i = 1 , 2 , 3 g_i(x,y)=T_i[f_i(x,y)]\quad i = 1,2,3 gi(x,y)=Ti[fi(x,y)]i=1,2,3
-
亮度增强
g i ( x , y ) = k f i ( x , y ) g_i(x,y)= kf_i(x,y) gi(x,y)=kfi(x,y)
-
饱和度增强
增加饱和度:彩色更浓,反差增加、边缘清晰
减小饱和度:部分区域成为灰色,整体比较平淡
-
色调增强
色调 ± 小常数:图像变“暖”或变“冷”
色调 ± 大常数:对图像感受会发生比较激烈的变化
假彩色增强
把真实景物图像的像素逐个地映射为另一个颜色,使目标在原图像中各突出。
操作:把多光谱图像中任三个光谱图像映射为可见光红、绿、蓝 三个可见光谱段的信号,再合成为一幅彩色图像。
把黑白图像,用灰度映射或频谱映射而成为类似真实彩色的处理
通常应用于GIS
2. 将一幅灰度影像增强,变换为彩色影像,并给出其变换换函数
实验环境配置
本次实验基于python3.9.1
使用numpy库和cv2库
使用matplotlib进行函数图像绘制
import numpy as np
import cv2
import matplotlib.pyplot as plt
实验思路
- 将图片读入并转成灰度图像
- 设计彩色映射函数
- 将灰度图直接套用函数进行输出
- 灰度图增强后再套用函数输出
核心代码
#彩色映射函数
for i in range(256):
    if i <= 63:
        self.r[i] = 0
        self.b[i] = 255
        self.g[i] = np.round(255 / 64 * i)
    elif i <= 127:
        self.r[i] = 0
        self.b[i] = np.round((255/64) * (128-i))
        self.g[i] = 255
    elif i <= 191:
        self.r[i] = np.round(255-(192 - i)*(255/64))
        self.b[i] = 0
        self.g[i] = 255
    else:
        self.r[i] = 255
        self.b[i] = 0
        self.g[i] = np.round((255 - i) * (255/64))
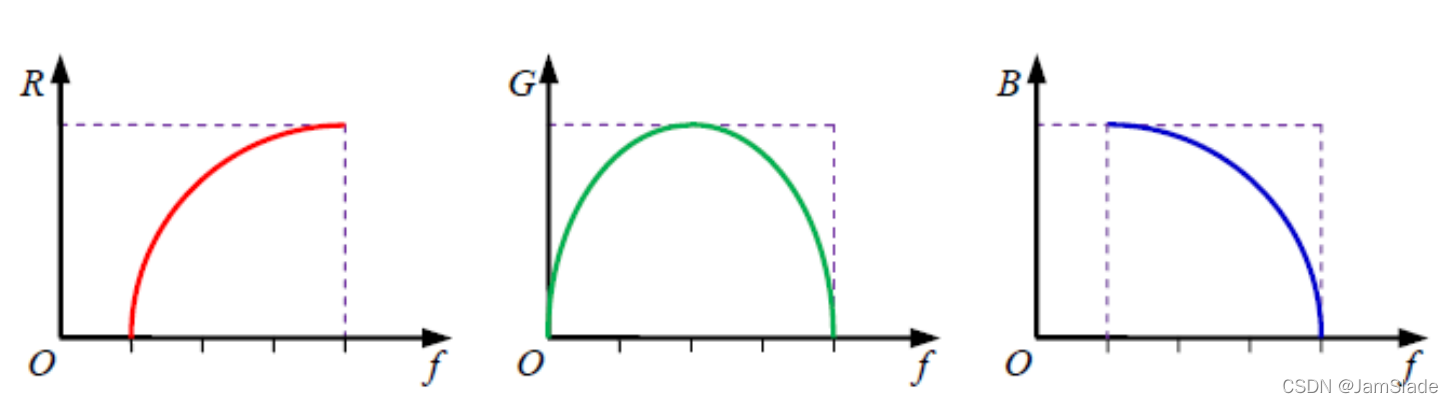
彩色函数具体形式如下
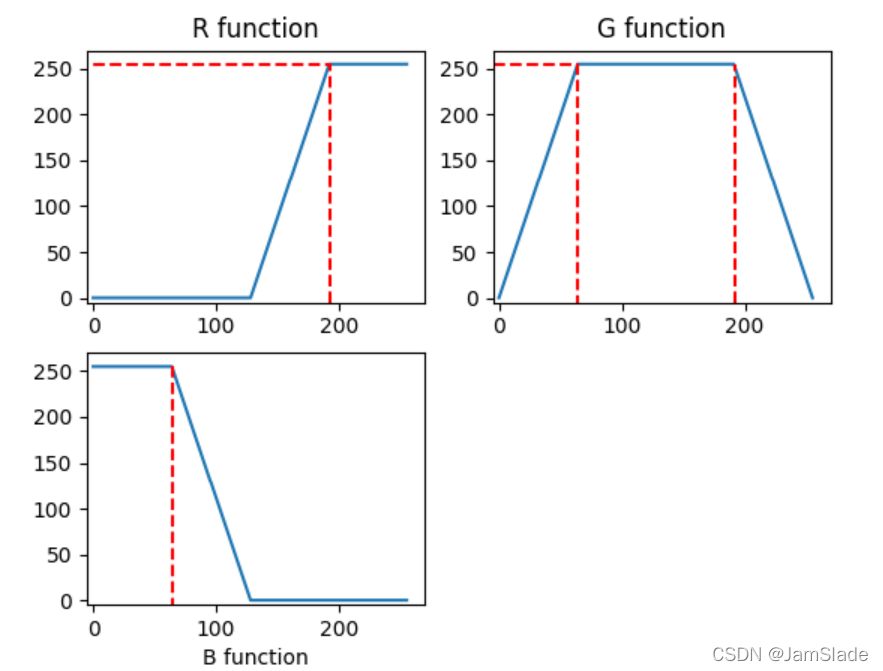
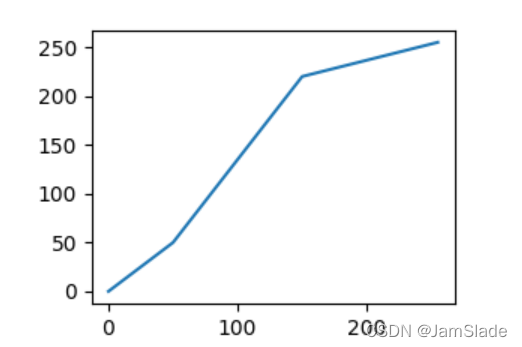
增强对比度函数具体形式如下
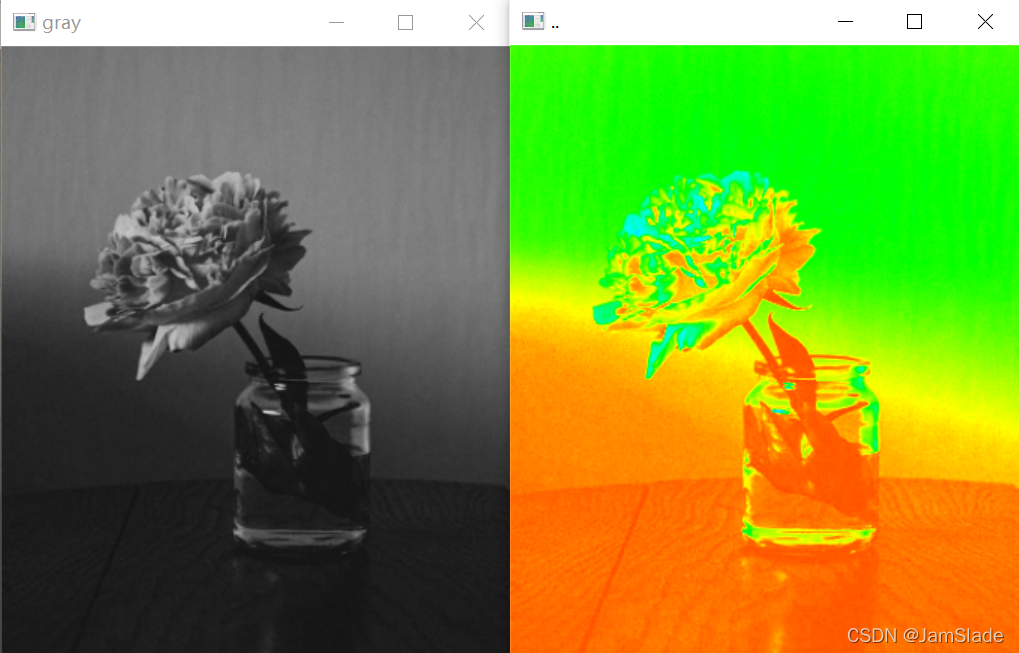
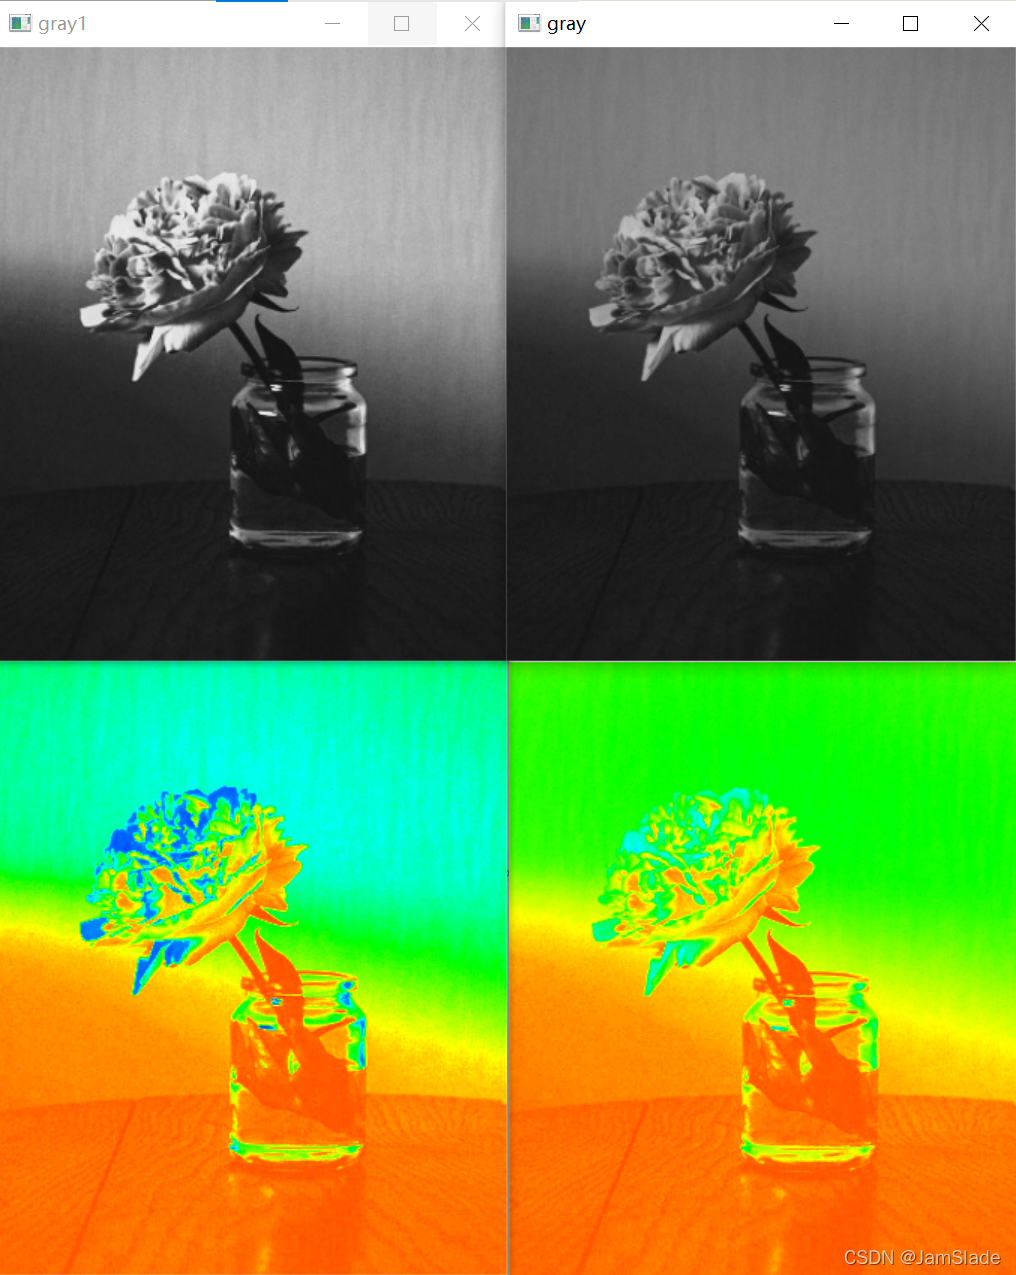
实验效果
未 灰 度 增 强 前 未灰度增强前 未灰度增强前
灰 度 增 强 ( 对 比 度 增 强 ) 后 灰度增强(对比度增强)后 灰度增强(对比度增强)后
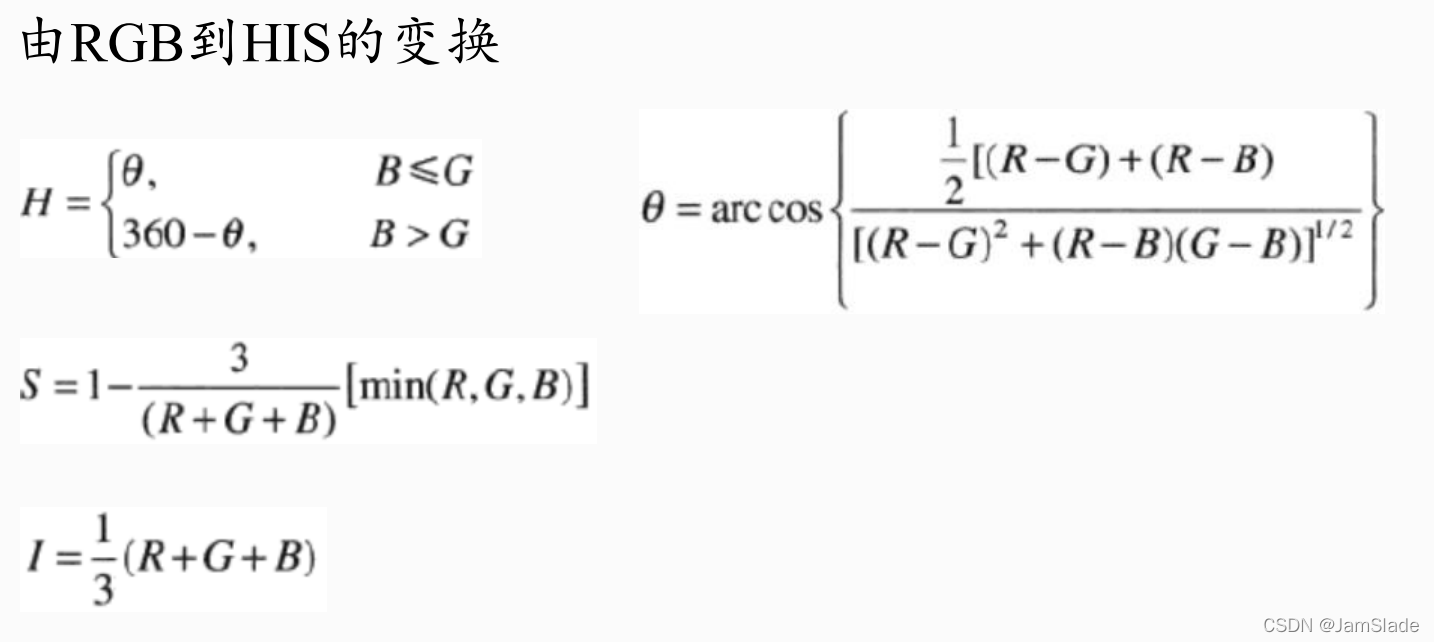
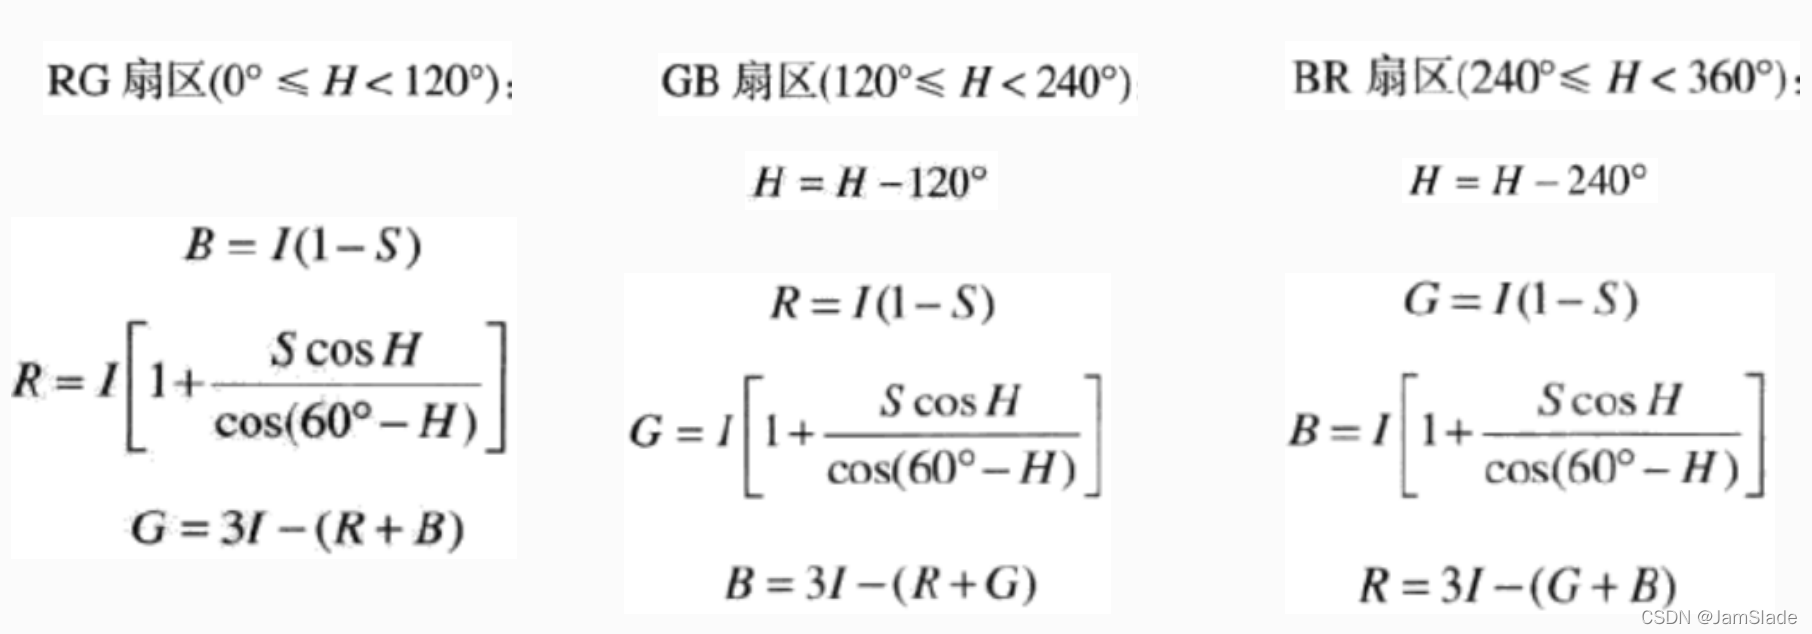
3. 将RGB影像变换到HIS彩色空间中,并对I分量进行压缩后,再反变换到RGB空间中,并分析参数对结果的影响。
实验配置环境
同2
实验思路
- 输入RGB图形
- 转为HSI图像
- 再通过HSI转回RGB图像
核心代码
for y in range(self.height):
    for x in range(self.width):
        numerator = 0.5*(2*self.r[y][x] - self.g[y][x] - self.b[y][x])
        denominator = np.sqrt((self.r[y][x] - self.g[y][x]) ** 2
          + (self.r[y][x] - self.b[y][x]) * (self.g[y][x] - self.b[y][x]))
        theta = np.arccos(numerator / denominator)

        if denominator == 0:
            H = 0
        elif self.b[y,x] <= self.g[y,x]:
            H = theta
        else:
            H = 2*np.pi-theta
        H /= (2*np.pi)

        min_RGB = min(self.b[y,x], self.r[y,x], self.g[y,x])
        sum = self.b[y,x]+self.r[y,x]+self.g[y,x]
        if sum == 0:
            S = 0
        else:
            S = 1 - 3 * min_RGB / sum

        I = sum / 3
        self.HSI[y,x] = np.array([H,S,I])*255
for y in range(self.height):
    for x in range(self.width):
        if self.s[y, x] < 1e-6:
            R = self.i[y, x]
            G = self.i[y, x]
            B = self.i[y, x]
        else:
            self.h[y, x] *= 360
            temp = self.h[y,x]
            if temp >= 0 and temp <= 120:
                B = self.i[y,x] * (1 - self.s[y,x])

                ScosH = self.s[y,x] * np.cos(self.h[y,x] * np.pi / 180)
                cos60H = np.cos((60-self.h[y,x]) *np.pi/180)

                R = self.i[y,x] * (1 + ScosH / cos60H)
                G = 3 * self.i[y,x] - R - B
            elif temp > 120 and temp <= 240:
                self.h[y,x] -= 120
                R = self.i[y,x] * (1 - self.s[y,x])
                ScosH = self.s[y,x] * np.cos(self.h[y,x] * np.pi / 180)
                cos60H = np.cos((60-self.h[y,x]) *np.pi/180)
                G = self.i[y,x] * (1 + ScosH / cos60H)
                B = 3 * self.i[y,x] - R - G
            else:
                self.h[y,x] -= 240
                G = self.i[y,x] * (1 - self.s[y,x])
                ScosH = self.s[y,x] * np.cos(self.h[y,x] * np.pi / 180)
                cos60H = np.cos((60-self.h[y,x]) *np.pi/180)
                B = self.i[y,x] * (1 + ScosH / cos60H)
                R = 3 * self.i[y,x] - B - G
        self.RGB[y,x] = np.array([R,G,B]) * 255
实验结果
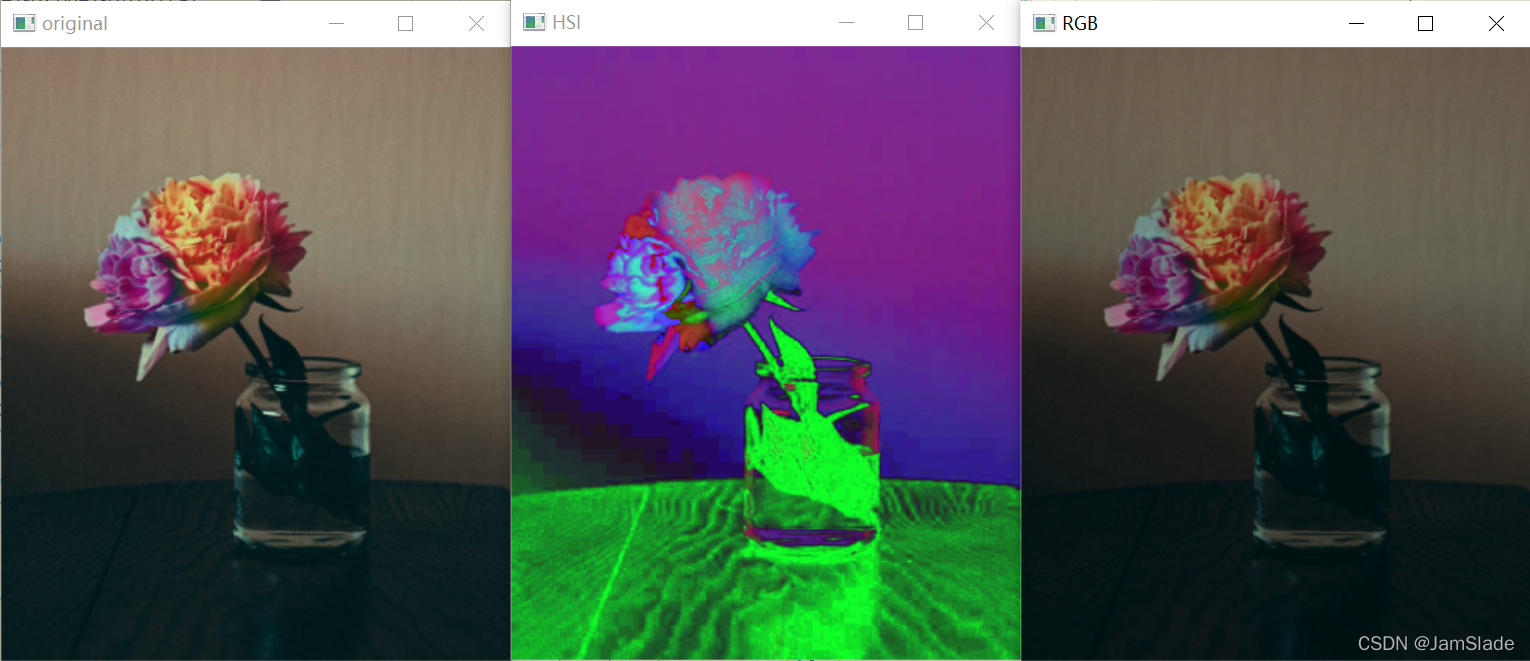
需要注意的是 H S I HSI HSI中 I I I表示亮度
当我对I进行*=0.9的时候,反变换的图像整体亮度就会下降
本次实验我对I部分进行了乘以0.9的操作
代码汇总
import numpy as np
import cv2
import matplotlib.pyplot as plt

class gray2color():
    r = np.zeros(256)
    b = np.zeros(256)
    g = np.zeros(256)
    def __init__(self, image):
        self.pic = image
        for i in range(256):
            if i <= 63:
                self.r[i] = 0
                self.b[i] = 255
                self.g[i] = np.round(255 / 64 * i)
            elif i <= 127:
                self.r[i] = 0
                self.b[i] = np.round((255/64) * (128-i))
                self.g[i] = 255
            elif i <= 191:
                self.r[i] = np.round(255-(192 - i)*(255/64))
                self.b[i] = 0
                self.g[i] = 255
            else:
                self.r[i] = 255
                self.b[i] = 0
                self.g[i] = np.round((255 - i) * (255/64))

    def show(self):
        x = np.arange(256)

        plt.subplot(2,2,1)
        plt.title('R function')
        plt.plot(x, self.r)
        plt.plot([192, 192, -5],[-5, 255, 255], 'r--')
        #画线
        plt.xlim([-5,270])
        plt.ylim([-5,270])

        plt.subplot(2,2,2)
        plt.title('G function')
        plt.plot(x, self.g)
        plt.plot([-5, 64, 64],[255, 255, -5], 'r--')
        plt.plot([192, 192],[-5, 255], 'r--')

        plt.xlim([-5,270])
        plt.ylim([-5,270])

        plt.subplot(2,2,3)
        plt.xlabel('B function')
        plt.plot(x, self.b)

        plt.plot([ 64, 64],[ 255, -5], 'r--')

        plt.xlim([-5,270])
        plt.ylim([-5,270])
        plt.show()

    def contrast_f(self, img:np, x1:int, y1:int, x2:int, y2:int):
        f = np.zeros(256)
        for i in range(len(f)):
            if i < x1:
                f[i] = y1/x1 *i
            elif i < x2:
                f[i] = ((y2 - y1) / (x2 - x1)) * (i - x1) + y1
            else:
                f[i] = ((y2 - 255.0) / (x2 - 255.0)) * (i - 255.0) + 255.0
        plt.plot(np.arange(256), f)
        plt.show()
        img = cv2.LUT(img, f)#f的一一映射
        return np.uint8(img+0.5)

    def trans(self):
        self.gray = cv2.cvtColor(self.pic, cv2.COLOR_RGB2GRAY)
        #plt.imshow(self.gray,cmap='gray')
        height, width = self.gray.shape[:]
        color = np.zeros((*self.gray.shape ,3))
        color1 = np.zeros((*self.gray.shape ,3))
        for y in range(height):
            for x in range(width):
                GRAY = self.gray[y][x]
                r = self.r[GRAY]
                b = self.b[GRAY]
                g = self.g[GRAY]
                color[y][x] = (r, g, b)
        gray1 = self.contrast_f(self.gray, 50, 50, 150,220)

        for y in range(height):
            for x in range(width):
                GRAY = gray1[y][x]
                r = self.r[GRAY]
                b = self.b[GRAY]
                g = self.g[GRAY]
                color1[y][x] = (r, g, b)
        cv2.imshow('original', self.pic)
        cv2.imshow('gray', self.gray)
        cv2.imshow('gray1', np.uint8(gray1))
        cv2.imshow('..',np.uint8(color))
        cv2.imshow('..1',np.uint8(color1))
        cv2.waitKey(0)


def test02():
    a = gray2color(cv2.imread('pic4.png'))
    #a.trans()
    a.show()


class RGB2HSI():

    def __init__(self, image:np):

        r,g,b = cv2.split(image)

        self.r = r / 255.0;
        self.g = g / 255.0;
        self.b = b / 255.0
        self.HSI = image.copy()
        #归一化
        self.height, self.width = self.HSI.shape[:2]
        self.h,self.s,self.i = cv2.split(self.HSI)

    def trans(self):

        for y in range(self.height):
            for x in range(self.width):
                numerator = 0.5*(2*self.r[y][x] - self.g[y][x] - self.b[y][x])
                denominator = np.sqrt((self.r[y][x] - self.g[y][x]) ** 2
                 + (self.r[y][x] - self.b[y][x]) * (self.g[y][x] - self.b[y][x]))
                theta = np.arccos(numerator / denominator)

                if denominator == 0:
                    H = 0
                elif self.b[y,x] <= self.g[y,x]:
                    H = theta
                else:
                    H = 2*np.pi-theta
                H /= (2*np.pi)

                min_RGB = min(self.b[y,x], self.r[y,x], self.g[y,x])
                sum = self.b[y,x]+self.r[y,x]+self.g[y,x]
                if sum == 0:
                    S = 0
                else:
                    S = 1 - 3 * min_RGB / sum

                I = sum / 3
                self.HSI[y,x] = np.array([H,S,I])*255

        return self.HSI

class HSI2RGB():
    def __init__(self, image) -> None:
        h,s,i = cv2.split(image)

        self.h = h / 255.0
        self.s = s / 255.0
        self.i = i / 255.0 * 0.75
        self.RGB = np.zeros_like(image)
        #归一化
        self.height, self.width = self.RGB.shape[:2]
        self.r,self.g,self.b = cv2.split(image)
    def trans(self):

        for y in range(self.height):
            for x in range(self.width):
                if self.s[y, x] < 1e-6:
                    R = self.i[y, x]
                    G = self.i[y, x]
                    B = self.i[y, x]
                else:
                    self.h[y, x] *= 360
                    temp = self.h[y,x]
                    if temp >= 0 and temp <= 120:
                        B = self.i[y,x] * (1 - self.s[y,x])

                        ScosH = self.s[y,x] * np.cos(self.h[y,x] * np.pi / 180)
                        cos60H = np.cos((60-self.h[y,x]) *np.pi/180)

                        R = self.i[y,x] * (1 + ScosH / cos60H)
                        G = 3 * self.i[y,x] - R - B
                    elif temp > 120 and temp <= 240:
                        self.h[y,x] -= 120
                        R = self.i[y,x] * (1 - self.s[y,x])
                        ScosH = self.s[y,x] * np.cos(self.h[y,x] * np.pi / 180)
                        cos60H = np.cos((60-self.h[y,x]) *np.pi/180)
                        G = self.i[y,x] * (1 + ScosH / cos60H)
                        B = 3 * self.i[y,x] - R - G
                    else:
                        self.h[y,x] -= 240
                        G = self.i[y,x] * (1 - self.s[y,x])
                        ScosH = self.s[y,x] * np.cos(self.h[y,x] * np.pi / 180)
                        cos60H = np.cos((60-self.h[y,x]) *np.pi/180)
                        B = self.i[y,x] * (1 + ScosH / cos60H)
                        R = 3 * self.i[y,x] - B - G
                self.RGB[y,x] = np.array([R,G,B]) * 255
        return np.uint8(self.RGB)
def test03():
    a = RGB2HSI(cv2.imread('pic4.png'))
    cv2.imshow('original', cv2.imread('pic4.png'))
    HSI = a.trans()
    b = HSI2RGB(HSI)
    RGB = b.trans()

    cv2.imshow('HSI',np.uint8(HSI))
    cv2.imshow('RGB',np.uint8(RGB))
    cv2.waitKey(0)

if __name__ == '__main__':
    #test02()
    test03()