option: {
xAxis: {
type: "category",
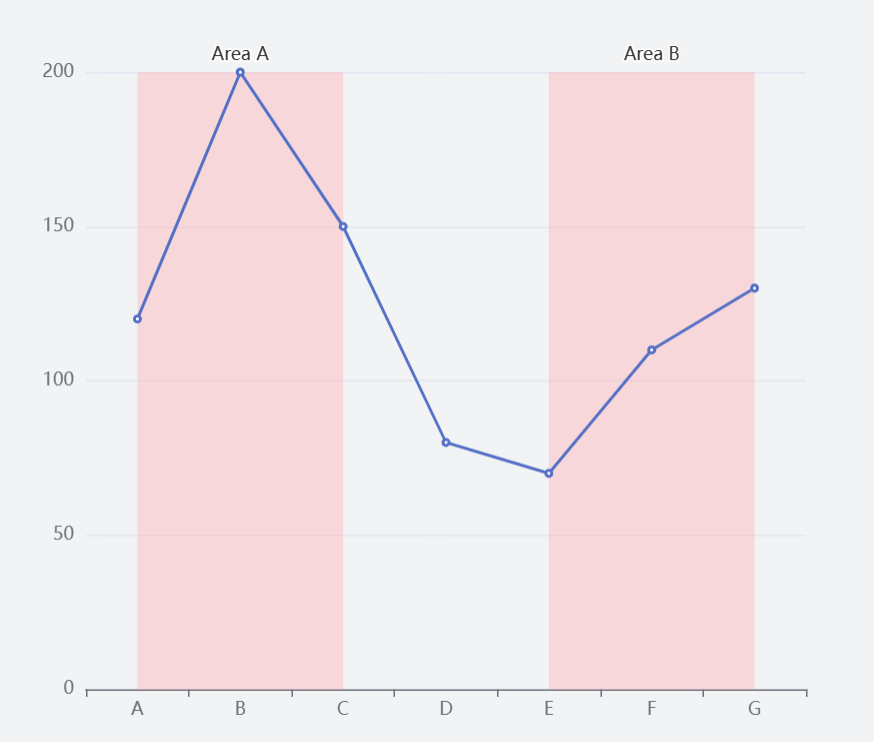
data: ["A", "B", "C", "D", "E", "F", "G"],
},
yAxis: {
type: "value",
},
series: [
{
data: [120, 200, 150, 80, 70, 110, 130],
type: "line",
// 添加markArea组件
markArea: {
// 设置markArea的样式
itemStyle: {
color: "rgba(255, 173, 177, 0.4)",
},
// 设置markArea的范围,可以是具体的值或百分比
data: [
[
{
name: "Area A",
xAxis: "A",
},
{
xAxis: "C",
},
],
[
{
name: "Area B",
xAxis: "E",
},
{
xAxis: "G",
},
],
],
},
},
],
}