
经过长达大半年时间的崩溃治理后,基于 Electron 框架开发的新版 PC 淘宝直播推流客户端的稳定性终于赶超基于QT 框架开发的旧版本了。剩下的崩溃问题中有 40% 是跟内存 OOM 有关,其中 V8FatalErrorCallback js heap OOM 问题整整困扰了我一个多月。历经千辛万苦终于破案并解决了这个问题,作为技术人来说还是非常兴奋的。为了了解该问题的来龙去脉,本文会从 V8FatalErrorCallback 崩溃问题的堆栈分析开始讲起,然后通过堆栈信息尝试各种解决方案,并对 v8 堆内存进行源码分析和尝试编译 electron 源码提升 v8 堆内存上限都不奏效后(如果对于编译 electron 源码不感兴趣,可以直接跳到 “如何用 Memory 和 Performance 工具分析内存泄漏问题“章节查看最终解决问题的方案),最终借助 chrome devtools 提供的 Memory 和 Performance 工具一步步排查和解决 Electron v8 引发的内存 OOM 问题,并且触类旁通解决其他内存 OOM 问题。

背景
▐ 为啥会上报 V8FatalErrorCallback 崩溃问题
让我们先来看下 V8FatalErrorCallback 崩溃上报的堆栈信息:
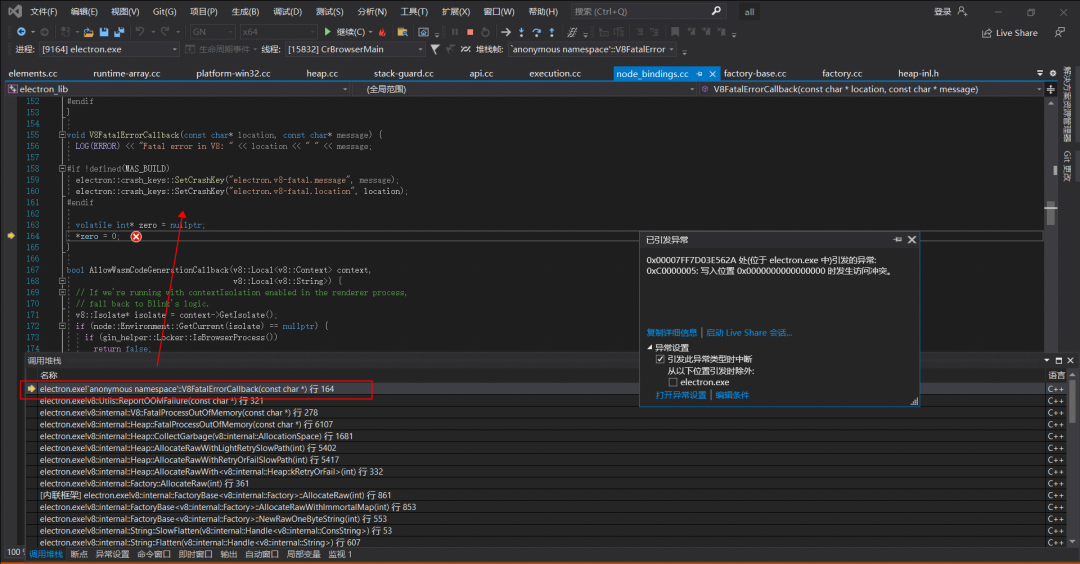
从上面的堆栈信息可以得知,由于 v8 执行老生代 GC 算法时 JaveScript heap out of memory 导致触发了 V8FatalErrorCallback 的崩溃上报。
既然是 v8 heap 堆内存 GC 后仍然无法回收空间导致 OOM,那会不会是缓存一直增长造成的?顺着这个思路发现在 Node.js 的 vm 中编译一段脚本时,最终依赖的对象叫 UnboundScript。在编译过程中,会逐步调用到下面的代码:
CompilationCache* compilation_cache = isolate->compilation_cache();


// 从 Compilation Cache 中查找是否命中
maybe_result = compilation_cache->LookupScript(
    source, script_details.name_obj, script_details.line_offset,
    script_details.column_offset, origin_options, isolate->native_context(),
    language_mode);


if (!maybe_result.is_null()) {
  // 若命中,则标记命中
  compile_timer.set_hit_isolate_cache();
} else if (can_consume_code_cache) {
  // 反序列化
  if (CodeSerializer::Deserialize(isolate, cached_data, source, origin_options).ToHandle(&inner_result) &&
      inner_result->is_compiled()) {
    // 将反序列化后的内容加入 Compilation Cache
    compilation_cache->PutScript(source, isolate->native_context(), language_mode, inner_result);
  }
}
大致意思是用源码去检索 Compilation Cache 中是否存在相同 key 的对象,若存在则直接返回已经存在的缓存,否则以源码字符串作为 key 将结果储存在 Compilation Cache 中(v8 分配的堆内存上)。
使用 Compilation Cache 的好处是可以加快脚本的编译速度,但副作用是该 Compilation Cache 只有在 CollectAllAvailableGarbage 时才会被回收,而正常的 GC 并不会回收该 Cache,导致 v8 堆内存一直上涨。当Node.js 14 / 16 对应的 v8 在堆内存抵达上限后,GC 时就会触发 V8FatalErrorCallback OOM 的“Bug”。
▐ 尝试解决 V8FatalErrorCallback 崩溃问题
若要解决该问题可通过设置 --no-compilation-cache 关闭 Compilation Cache,但如此一来则无法享受 Compilation Cache。经过权衡之后,我们把主进程的 require('v8-compile-cache') 代码去掉,并且设置如下命令关闭 Compilation Cache,然后高高兴兴地发了个修复版本。
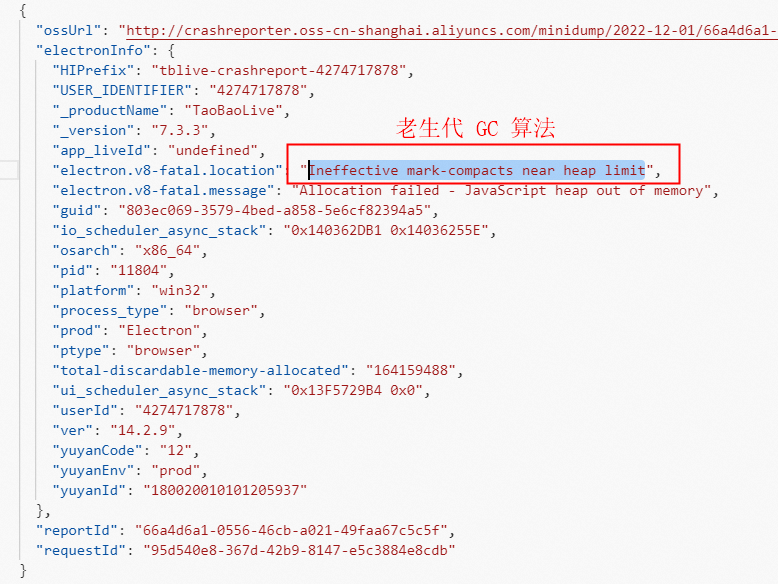
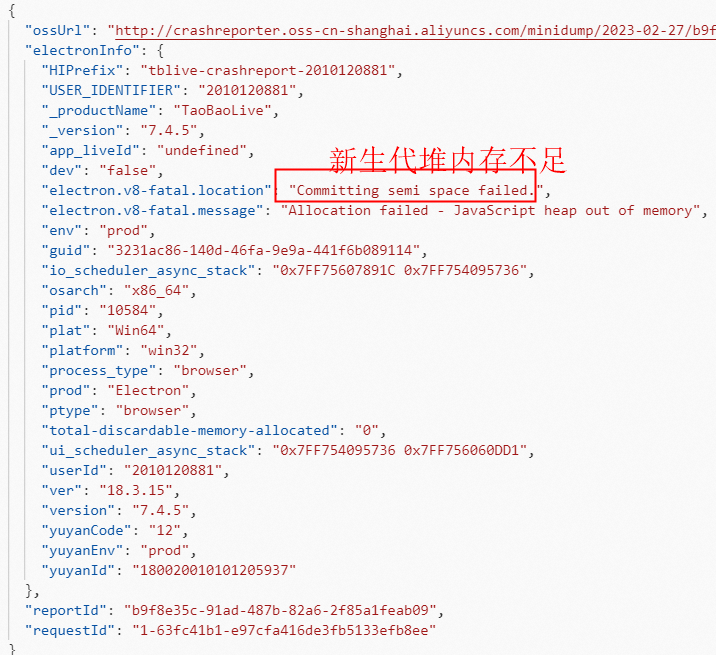
app.commandLine.appendSwitch('js-flags', '--no-compilation-cache')过两天一看,怎么还是有一堆 V8FatalErrorCallback 崩溃问题上报?通过进一步分析崩溃堆栈信息发现,除了 v8 老生代堆内存 OOM 外,还有下面两类 v8 新生代堆内存 OOM 问题:
v8 新生代内存申请时报 “young object promotion failed”导致 OOM 崩溃
v8 新生代内存申请时报 “reach heap limit”导致 OOM 崩溃
于是尝试将 v8 新生代内存最大值从默认的 16M 提高到 64M(从默认的 16M 设置到 64M 时,Node 应用的整体 GC 性能是有显著提升的,并且反映到压测 QPS 上大约提升了 10%。但是进一步将 Semi space 增大到 128M 和 256M 时,收益确并不明显。而且 Semi space 本身也是作用于新生代对象快速内存分配,本身不宜设置的过大,因此这次优化最终选取最优运行时 Semi space 的值为 64M),对应设置如下,然后抱着试一试的心态再次发了个修复版本。
app.commandLine.appendSwitch('js-flags', '--max-semi-space-size=64')果不其然,这次发版并没有彻底修复问题。那还有什么解决方案呢?绞劲脑汁想了半天,还是毫无头绪,看来只能通过提升 v8 堆内存上限来延缓 V8FatalErrorCallback 崩溃问题了,对应设置如下:
app.commandLine.appendSwitch('js-flags', '--max-old-space-size=8192')但没想到这种设置也有坑,设置后死活不生效,v8 还是默认的 4G 堆内存上限。没办法,只能硬着头皮查看 v8 源码分析下堆内存限制的原理。
▐ 通过 v8 源码分析堆内存限制原理
接下来我们通过 v8 源码一步步分析堆内存限制的实现原理,代码逻辑图如下所示:

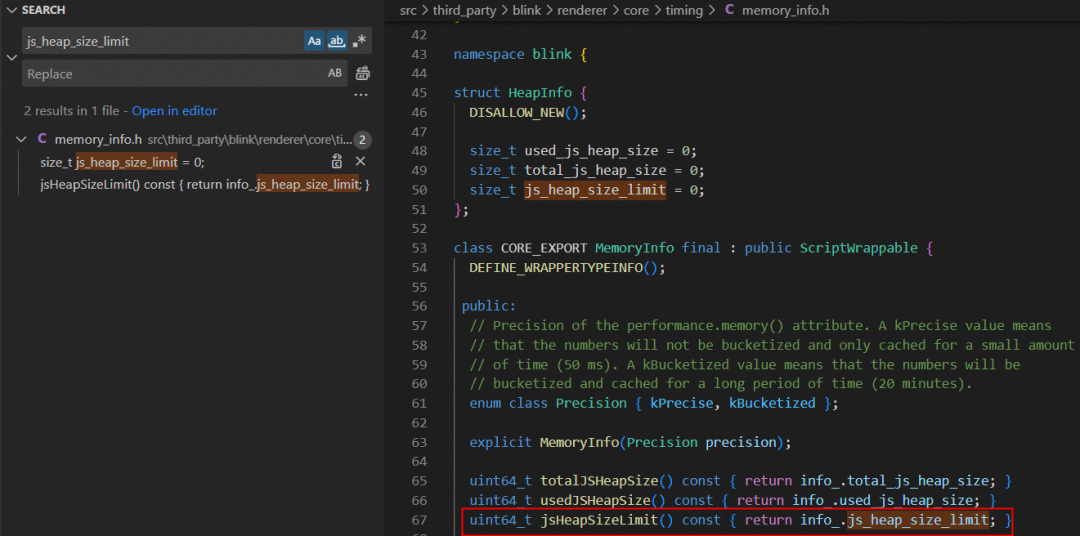
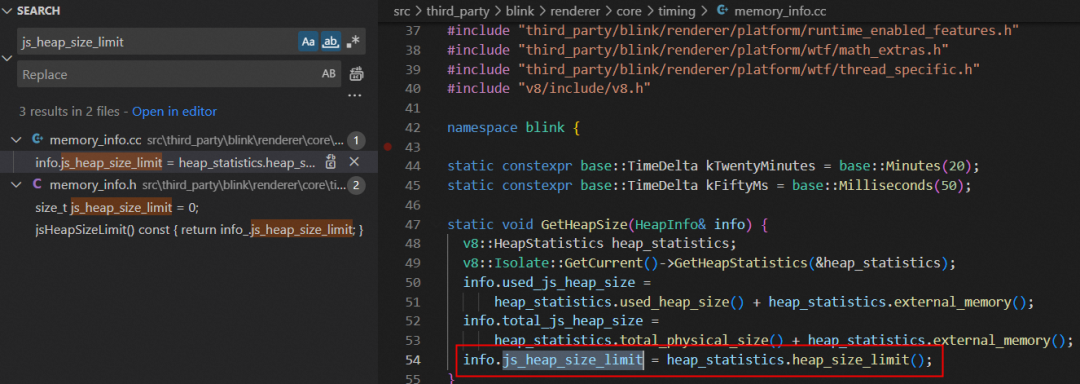
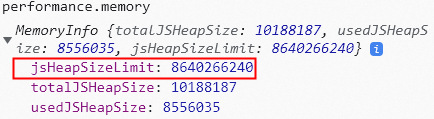
首先打开 src\third_party\blink\renderer\core\timing\memory_info.h 文件,看注释里得知 performance.memory 方法也是从这里获取的 v8 堆内存信息,包括 jsHeapSizeLimit 方法获取的 info.js_heap_size_limit 变量值就是 v8 堆内存上限。
然后打开 src\third_party\blink\renderer\core\timing\memory_info.cc 文件,发现是从 heap_statistics 的 heap_size_limit 方法获取的值赋值给 info.js_heap_size_limit 变量。
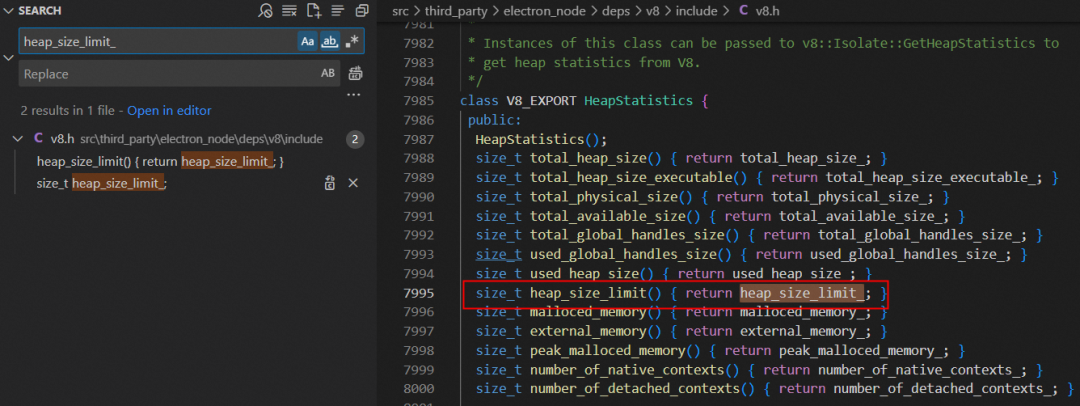
接着打开 src\third_party\electron_node\deps\v8\include\v8.h 文件,发现 heap_size_limit 方法返回的是 heap_size_limit_ 变量值。
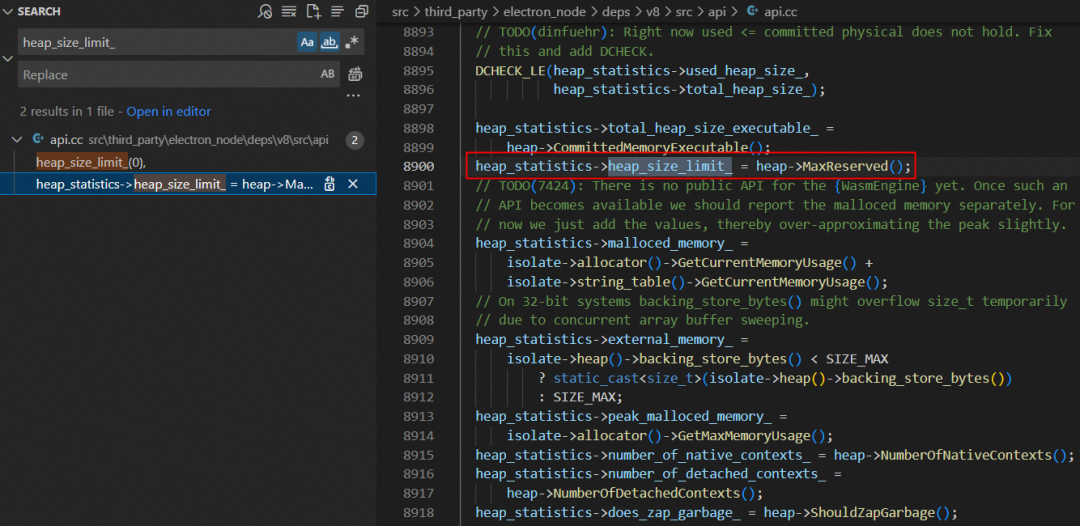
紧接着打开 src\third_party\electron_node\deps\v8\src\api\api.cc 文件,发现是从 heap 的 MaxReserved 方法获取的值赋值给 heap_size_limit_ 变量。
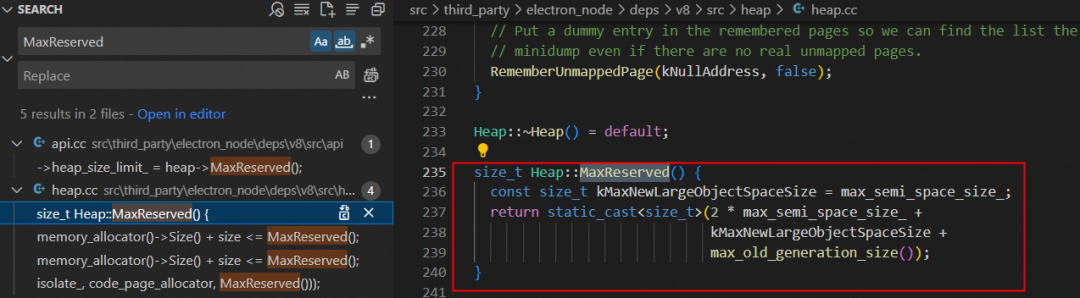
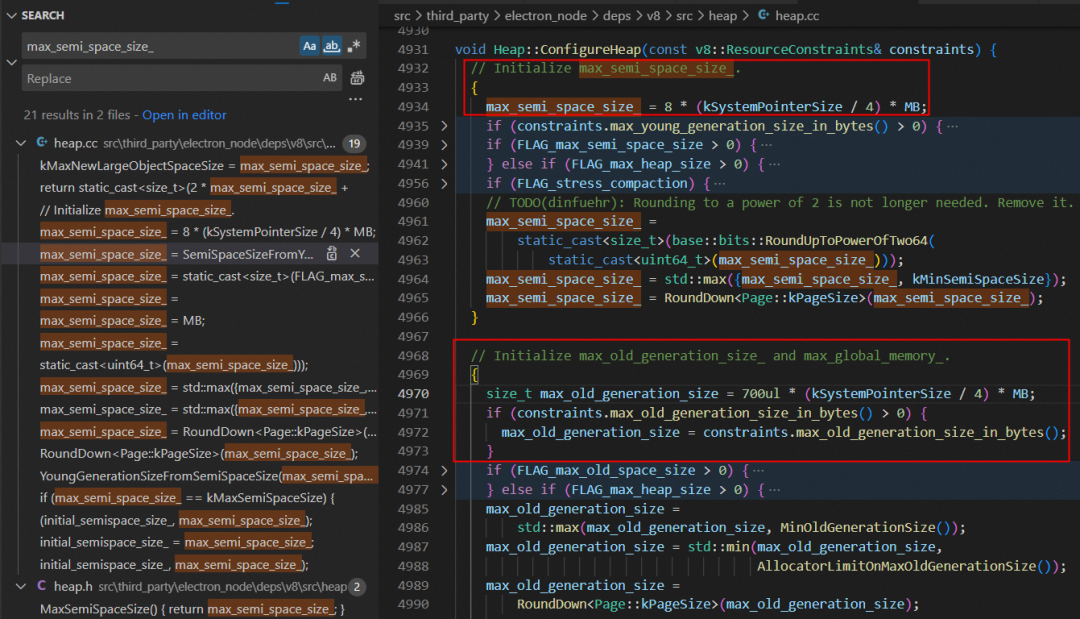
继续打开 src\third_party\electron_node\deps\v8\src\heap\heap.cc 文件,终于在 MaxReserved 方法找到详细的实现逻辑了。从下面的代码逻辑可以得知,v8 堆内存上限就等于 3 * max_semi_space_size_ + max_old_generation_size_。
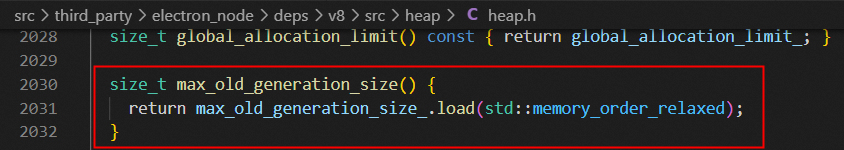
最后我们在 src\third_party\electron_node\deps\v8\src\heap\heap.cc 文件的 ConfigureHeap 方法里找到了初始化 max_semi_space_size_ 和 max_old_generation_size_ 这两个变量的逻辑:
max_semi_space_size_
其中 kSystemPointerSize 等于 sizeof(void*),在 32 位系统是 4 个字节,64 位系统是 8 个字节。也就是说,默认情况下 max_semi_space_size_ 的初始值就是 8MB(32 位)/ 16MB(64 位)。
constexpr int kSystemPointerSize = sizeof(void*);
max_semi_space_size_ = 8 * (kSystemPointerSize / 4) * MB;
当然,我们也可以通过下面的指令重设 max_semi_space_size_ 的值。
app.commandLine.appendSwitch('js-flags', '--max-semi-space-size=xxx')max_old_generation_size_
同理,默认情况下 max_old_generation_size_ 的初始值是 700MB(32 位)/ 1400MB(64 位)。
constexpr int kSystemPointerSize = sizeof(void*);
size_t max_old_generation_size = 700ul * (kSystemPointerSize / 4) * MB;
如果这两个变量都按默认值来算的话,32 位系统下 v8 堆内存上限等于 724M(3 * 8M + 700M),64 位系统下 v8 堆内存上限等于 1448M(3 * 16M + 1400M)。但为啥我的 64 位电脑系统下 v8 堆内存上限有 4096M(heapSizeLimit 字段对应的值) 呢?
{
  totalHeapSize: 26332,
  totalHeapSizeExecutable: 768,
  totalPhysicalSize: 26332,
  totalAvailableSize: 4174396,
  usedHeapSize: 19029,
  heapSizeLimit: 4194048,
  mallocedMemory: 512,
  peakMallocedMemory: 9096,
  doesZapGarbage: false
}
这是因为我们刚刚看的计算逻辑只是默认情况下的初始值,实际上现在的 v8 还会根据设备的性能来设置限制,所以我们需要针对这个再往下深挖,先看下面这段代码逻辑:
if (constraints.max_old_generation_size_in_bytes() > 0) {
  max_old_generation_size = constraints.max_old_generation_size_in_bytes();
}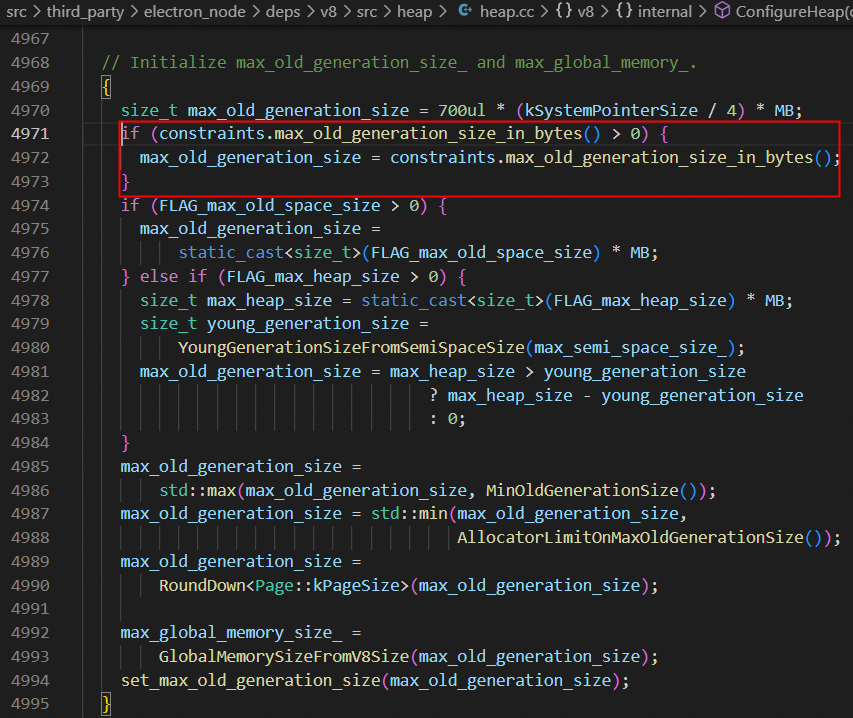
其中 max_old_generation_size_in_bytes 只是获取 max_old_generation_size_ 的 getter 方法,我们需要看具体是哪里调用 set_max_old_generation_size_in_bytes 这个 setter 方法设置该值的。
/**
 * The maximum size of the old generation.
 * When the old generation approaches this limit, V8 will perform series of
 * garbage collections and invoke the NearHeapLimitCallback.
 * If the garbage collections do not help and the callback does not
 * increase the limit, then V8 will crash with V8::FatalProcessOutOfMemory.
 */
// getter
size_t max_old_generation_size_in_bytes() const {
  return max_old_generation_size_;
}
// setter
void set_max_old_generation_size_in_bytes(size_t limit) {
  max_old_generation_size_ = limit;
}
细查可见是在 src\third_party\electron_node\deps\v8\src\api\api.cc 文件里 ConfigureDefaults 方法调用 set_max_old_generation_size_in_bytes,然后传入 old_generation 变量值进行赋值的。而跟该变量值相关的 GenerationSizesFromHeapSize 只是个简单的二分查找,先将 old_generation 设置为 heap_size 的一半,然后计算 young_generation 的值,看二者加起来是否大于 heap_size,若大于则再将 old_generation 减半,以此再迭代。可以看出,核心还是要看 heap_size 是如何计算的。

继续看 HeapSizeFromPhysicalMemory 方法里 heap_size 的计算实现逻辑,原来 old_generation 取的是物理内存通过系数计算出来的值(如电脑物理内存为 16G,则计算得到的值为 8G)和 v8 的最大内存限制(如电脑物理内存为 16G,则计算得到的值为 4G)二者中的最小值。
其中 MaxOldGenerationSize 方法中定义了 v8 的最大老生代的限制,如果按照我的 64 位电脑物理内存 16G 配置的话,则计算得出 old_generation 为 4096M,最终这个值就是 v8 堆内存上限,跟前面 heapSizeLimit 字段值可以对上。
static constexpr size_t kPhysicalMemoryToOldGenerationRatio = 4;
static const int kHeapLimitMultiplier = kSystemPointerSize / 4;
static constexpr size_t kMaxSize = 1024u * Heap::kHeapLimitMultiplier * MB;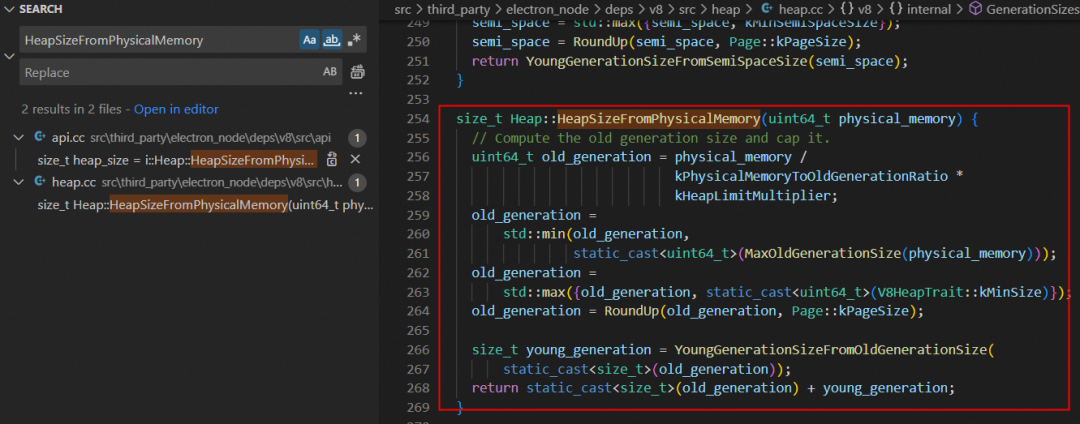
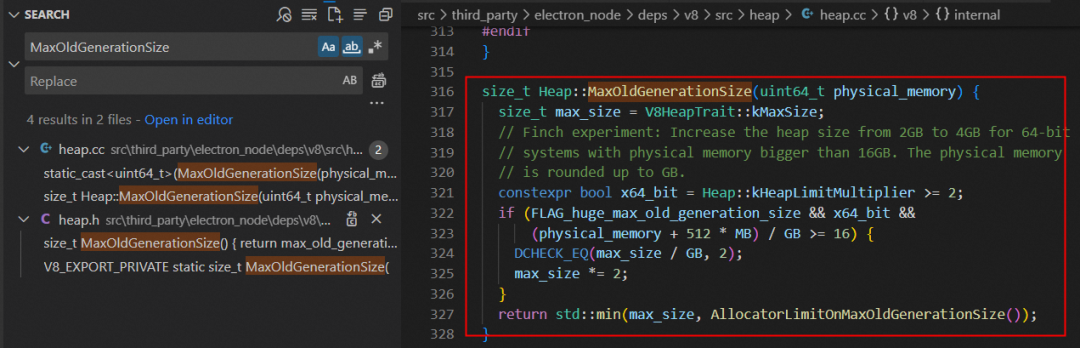
经过上面的源码分析后,电脑物理内存 16G 配置的话 v8 堆内存上限确实只有 4G,主要还是因为 v8 的 v9.2 版本默认使用了指针压缩导致。
那要怎么突破 v8 堆内存上限呢?办法总归是有的,请继续阅读下文。

如何通过编译 Electron 源码提升 v8 堆内存上限
为了突破 v8 堆内存上限,我们需要重新编译 Electron 源码,下面会详细介绍如何编译出一个提升 v8 堆内存上限的 Electron 版本。
▐ 构建前配置科学上网环境
首先需要确保电脑系统具备如下环境:
科学上网环境
Visual Studio 2019 版本(推荐版本)
Node.js(建议使用最新稳定版本)
Git(建议使用最新稳定版本)
Python3(推荐版本)
Debugging Tools for Windows of Windows SDK(根据电脑系统的实际情况确定使用哪个版本)
卸载 nvm 工具(如果有安装的话)
至少 25 GB 的磁盘空间剩余
准备好这些环境后,接着通过 git 命令下载谷歌提供的 depot_tools 工具:
> git clone https://chromium.googlesource.com/chromium/tools/depot_tools.git我们也可以通过谷歌提供的下载地址下载该工具,下载完成后把压缩包解压到 D:\depot_tools 目录(具体路径可以自行设置),确保该目录下存在 .git 子目录和 gclient.bat 批处理文件才行。
然后在系统环境变量中增加 depot_tools 的目录路径(注意这个路径必须在所有其他环境变量之前),如下图所示:
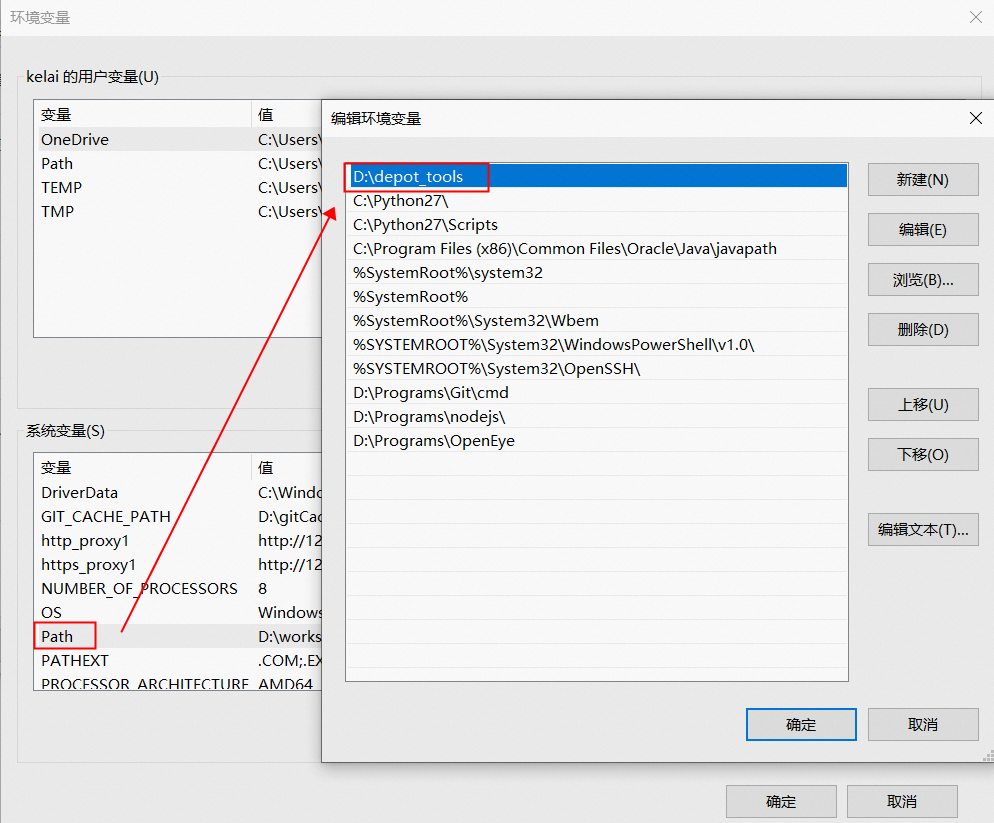
接着再增加下面 5 个系统环境变量:
DEPOT_TOOLS_WIN_TOOLCHAIN: 0
DEPOT_TOOLS_DIR: D:\depot_tools
GIT_CACHE_PATH: D:\.gitCache
http_proxy: http://127.0.0.1:13658
https_proxy: http://127.0.0.1:13658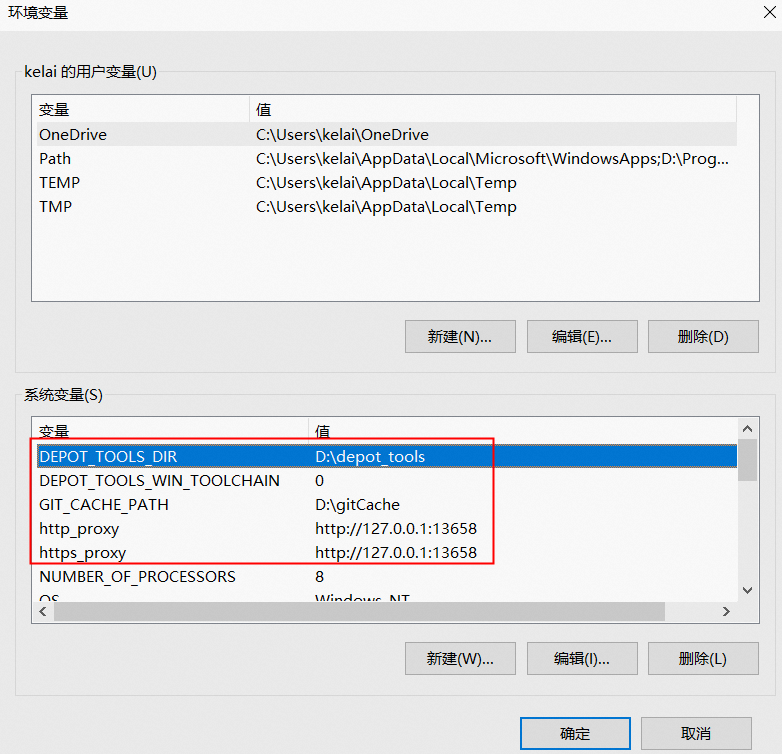
DEPOT_TOOLS_WIN_TOOLCHAIN:使 depot_tools 工具不下载 Visual Studio 工具链(否则 depot_tools 将会下载一个只有谷歌内部员工才有权限使用的 Visual Studio,做此设置的前提是需要自己安装好 Visual Studio 开发工具)。
GIT_CACHE_PATH:设置 git 的缓存目录,由于构建过程中需要下载大约 10 GB 的源码及资源文件,因此要防备网络断开、下载失败等情况,如果团队中其他成员也需要构建 Electron,那可以考虑共享 git 的缓存目录来提升构建效率。
http_proxy / https_proxy:为 Python 提供科学上网的支持。
最后还需要为一系列的工具配置科学上网的环境:
控制台输入下面指令设置 git 的科学上网环境,注意端口号以电脑系统配置的代理端口号为准。
> git config --global https.proxy http://127.0.0.1:13658
> git config --global http.proxy http://127.0.0.1:13658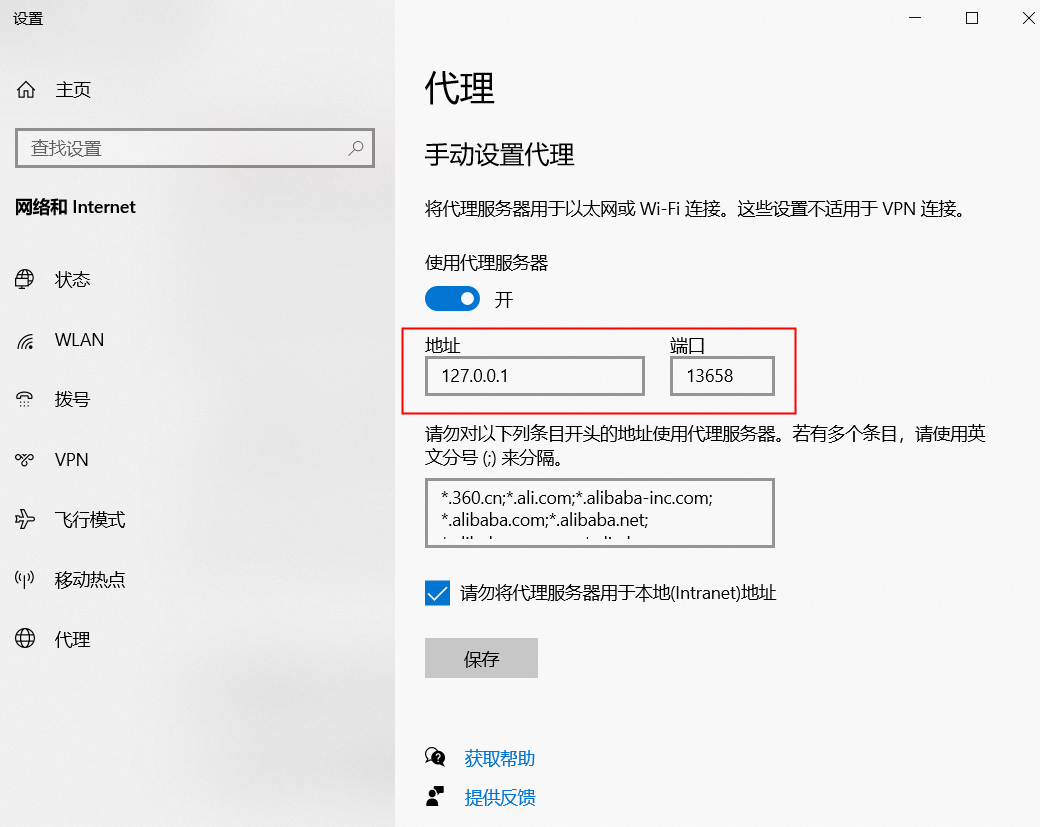
控制台输入下面指令设置 node.js 的科学上网的环境,注意端口号以电脑系统配置的代理端口号为准。
> npm config set proxy=http://127.0.0.1:13658
> npm config set https-proxy http://127.0.0.1:13658
控制台输入下面指令设置 gclient 的代理,注意端口号以电脑系统配置的代理端口号为准。
> set http_proxy=http://127.0.0.1:13658
> set https_proxy=http://127.0.0.1:13658
控制台输入下面指令设置 winhttp 的代理,注意端口号以电脑系统配置的代理端口号为准。
> C:\Windows\system32>netsh
> netsh>winhttp
> netsh winhttp>
> netsh winhttp>set proxy http://127.0.0.1:13658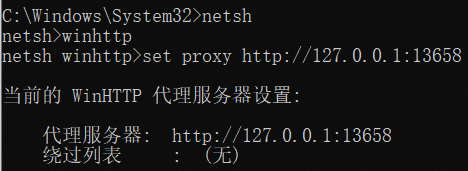
▐ 构建不同版本的 Electron
当构建依赖的工具都配置好科学上网的环境后,就可以开始构建 Electron 源码了。接下来会分别介绍如何构建 nightly、release、debug、突破 V8 堆内存上限等不同版本的 Electron。
构建 nightly 版本的 Electron
首先创建一个目录,然后在该路径下用管理员的身份启动命令行工具 cmd.exe(不能使用 PowerShell、cygwin、Git Bash 等工具) 执行下面 3 个指令,用来初始化编译环境并同步 Chromium、Electron 和 node.js 的代码及其相关依赖。
> gclient config --name "src/electron" --unmanaged https://github.com/electron/electron> gclient sync --with_branch_heads --with_tags> gclient sync -f因为 gclient 要下载 Chromium、Electron、node.js 等源码及资源文件与构建工具,所以这个过程非常漫长,请耐心等待。如果执行 "gclient sync --with_branch_heads --with_tags" 指令时遇到了下载 dugite(用于构建 Git 版本的工具)失败的问题,可以自行下载压缩包后放在当前目录下,然后再重新执行上述指令。
Downloading Git from: https://github.com/desktop/dugite-native/releases/download/v2.29.3-2/dugite-native-v2.29.3-3d467be-windows-x64.tar.gz
Error raised while downloading https://github.com/desktop/dugite-native/releases/download/v2.29.3-2/dugite-native-v2.29.3-3d467be-windows-x64.tar.gz GotError [RequestError]: read ECONNRESET
    at ClientRequest.<anonymous> (D:\workspace\electron\src\electron\node_modules\dugite\node_modules\got\source\request-as-event-emitter.js:178:14)
    at Object.onceWrapper (node:events:628:26)
    at ClientRequest.emit (node:events:525:35)
    at ClientRequest.origin.emit (D:\workspace\electron\src\electron\node_modules\dugite\node_modules\@szmarczak\http-timer\source\index.js:37:11)
    at TLSSocket.socketErrorListener (node:_http_client:481:9)
    at TLSSocket.emit (node:events:513:28)
    at emitErrorNT (node:internal/streams/destroy:157:8)
    at emitErrorCloseNT (node:internal/streams/destroy:122:3)
    at processTicksAndRejections (node:internal/process/task_queues:83:21) {
  code: 'ECONNRESET',
  host: 'github.com',
  hostname: 'github.com',
  method: 'GET',
  path: '/desktop/dugite-native/releases/download/v2.29.3-2/dugite-native-v2.29.3-3d467be-windows-x64.tar.gz',
  socketPath: undefined,
  protocol: 'https:',
  url: 'https://github.com/desktop/dugite-native/releases/download/v2.29.3-2/dugite-native-v2.29.3-3d467be-windows-x64.tar.gz',
  gotOptions: {
    path: '/desktop/dugite-native/releases/download/v2.29.3-2/dugite-native-v2.29.3-3d467be-windows-x64.tar.gz',
    protocol: 'https:',
    slashes: true,
    auth: null,
    host: 'github.com',
    port: null,
    hostname: 'github.com',
    hash: null,
    search: null,
    query: null,
    pathname: '/desktop/dugite-native/releases/download/v2.29.3-2/dugite-native-v2.29.3-3d467be-windows-x64.tar.gz',
    href: 'https://github.com/desktop/dugite-native/releases/download/v2.29.3-2/dugite-native-v2.29.3-3d467be-windows-x64.tar.gz',
    retry: {
      retries: [Function (anonymous)],
      methods: [Set],
      statusCodes: [Set],
      errorCodes: [Set]
    },
    headers: {
      'user-agent': 'dugite',
      accept: 'application/octet-stream',
      'accept-encoding': 'gzip, deflate'
    },
    hooks: {
      beforeRequest: [],
      beforeRedirect: [],
      beforeRetry: [],
      afterResponse: [],
      beforeError: [],
      init: []
    },
    decompress: true,
    throwHttpErrors: true,
    followRedirect: true,
    stream: true,
    form: false,
    json: false,
    cache: false,
    useElectronNet: false,
    secureProtocol: 'TLSv1_2_method',
    method: 'GET'
  }
}
等控制台输出下面的结果后,表明上述指令已执行完成。
Operation completed over 1 objects/69.2 MiB.
Hook 'python3 src/tools/update_pgo_profiles.py --target=win32 update --gs-url-base=chromium-optimization-profiles/pgo_profiles' took 20.10 secs
Running hooks:  62% (86/137) Fetch PGO profiles for win64
________ running 'python3 src/tools/update_pgo_profiles.py --target=win64 update --gs-url-base=chromium-optimization-profiles/pgo_profiles' in 'D:\workspace\electron'
Copying gs://chromium-optimization-profiles/pgo_profiles/chrome-win64-main-1672768604-8da543c818b6aea3eae2ad5cb80cfe61abd454a1.profdata...
Downloading to temp gzip filename D:\workspace\electron\src\chrome\build\pgo_profiles\chrome-win64-main-1672768604-8da543c818b6aea3eae2ad5cb80cfe61abd454a1.profdata_.gztmp
Uncompressing temporarily gzipped file to D:\workspace\electron\src\chrome\build\pgo_profiles\chrome-win64-main-1672768604-8da543c818b6aea3eae2ad5cb80cfe61abd454a1.profdata...
\ [1 files][ 68.5 MiB/ 68.5 MiB]    7.2 MiB/s
Operation completed over 1 objects/68.5 MiB.
Hook 'python3 src/tools/update_pgo_profiles.py --target=win64 update --gs-url-base=chromium-optimization-profiles/pgo_profiles' took 21.92 secs
Running hooks:  67% (93/137) style_perftest_files
________ running 'python3 src/third_party/depot_tools/download_from_google_storage.py --no_auth --quiet --bucket chromium-style-perftest -d src/third_party/blink/renderer/core/css/perftest_data' in 'D:\workspace\electron'
NOTICE: You have PROXY values set in your environment, but gsutilin depot_tools does not (yet) obey them.
Also, --no_auth prevents the normal BOTO_CONFIG environmentvariable from being used.
To use a proxy in this situation, please supply those settingsin a .boto file pointed to by the NO_AUTH_BOTO_CONFIG environmentvariable.
Hook 'python3 src/third_party/depot_tools/download_from_google_storage.py --no_auth --quiet --bucket chromium-style-perftest -d src/third_party/blink/renderer/core/css/perftest_data' took 81.51 secs
Running hooks: 100% (137/137), done.
接着再执行下面的指令,此时会在 src/out/Testing(Testing 名称可以更改,但 src/out 子目录不能更改) 子目录内生成一个测试配置文件夹,然后我们会使用这个文件夹下的 testing.gn 构建脚本来构建 Electron 源码。
> cd src
> set CHROMIUM_BUILDTOOLS_PATH=%cd%\buildtools
> gn gen out/Testing --args="import(\"//electron/build/args/testing.gn\")"
如果执行上述指令时遇到下面报错信息,可以直接看解决方法。
若 gn 没找到 src/buildtools 的路径,则解决方法如下:
检查环境变量 CHROMIUM_BUILDTOOLS_PATH 的值是否为 src 目录下 buildtools 的路径。
在 src 的上一级目录保留 .gclient 和 .gclient_entries 文件。
gn gen out/Testing --args="import(\"//electron/build/args/testing.gn\")"
gn.py: Could not find checkout in any parent of the current path.
This must be run inside a checkout.
若安装的 Windows 10 SDK 版本不匹配,解决方法如下:
Traceback (most recent call last):
  File "D:/workspace/electron/src/build/toolchain/win/setup_toolchain.py", line 315, in <module>
    main()
  File "D:/workspace/electron/src/build/toolchain/win/setup_toolchain.py", line 273, in main
    env = _LoadToolchainEnv(cpu, toolchain_root, win_sdk_path, target_store)
  File "D:/workspace/electron/src/build/toolchain/win/setup_toolchain.py", line 189, in _LoadToolchainEnv
    return _ExtractImportantEnvironment(variables)
  File "D:/workspace/electron/src/build/toolchain/win/setup_toolchain.py", line 67, in _ExtractImportantEnvironment
    raise Exception(
Exception: Path "C:\Program Files (x86)\Windows Kits\10\include\10.0.20348.0\shared" from environment variable "include" does not exist. Make sure the necessary SDK is installed.
ERROR at //build/toolchain/win/toolchain.gni:500:24: Script returned non-zero exit code.
  win_toolchain_data = exec_script("//build/toolchain/win/setup_toolchain.py",
                       ^----------
Current dir: D:/workspace/electron/src/out/Testing/
Command: D:/workspace/depot_tools/bootstrap-2@3_8_10_chromium_26_bin/python3/bin/python3.exe D:/workspace/electron/src/build/toolchain/win/setup_toolchain.py "C:\Program Files (x86)\Microsoft Visual Studio\2019\Community" "C:\Program Files (x86)\Windows Kits\10" "C:\Windows\System32;C:\Windows\SysWOW64;Arm64Unused" win x86 environment.x86
Returned 1.
See //build/toolchain/win/BUILD.gn:34:3: whence it was called.
  win_toolchains("x86") {
  ^----------------------
See //BUILD.gn:83:1: which caused the file to be included.
group("gn_all") {
首先打开 Visual Studio Installer(该工具跟 Visual Studio 一起安装),然后点击“修改”按钮,如下图所示:
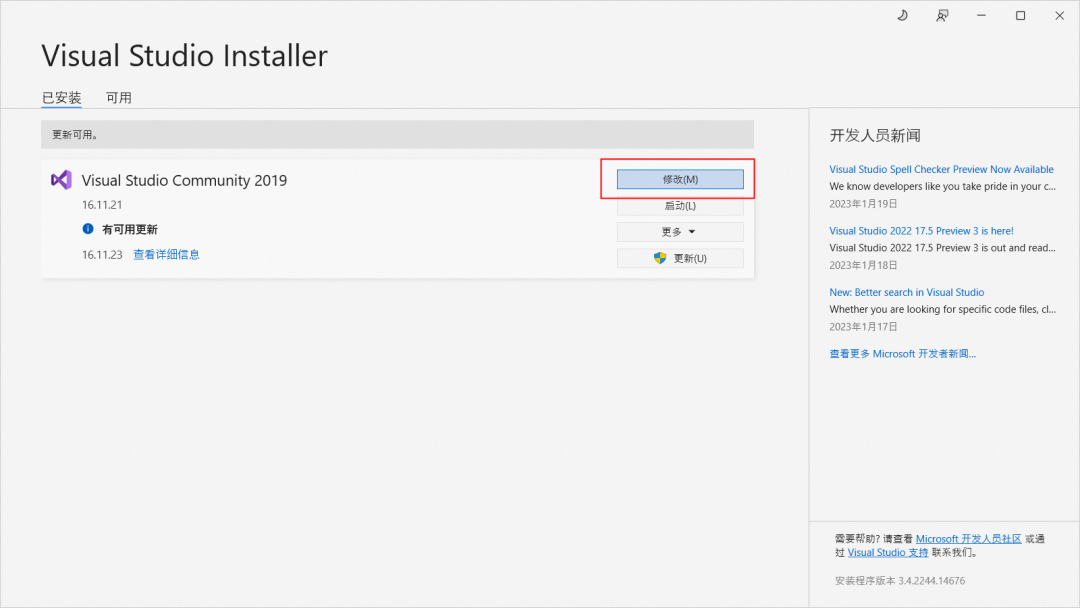
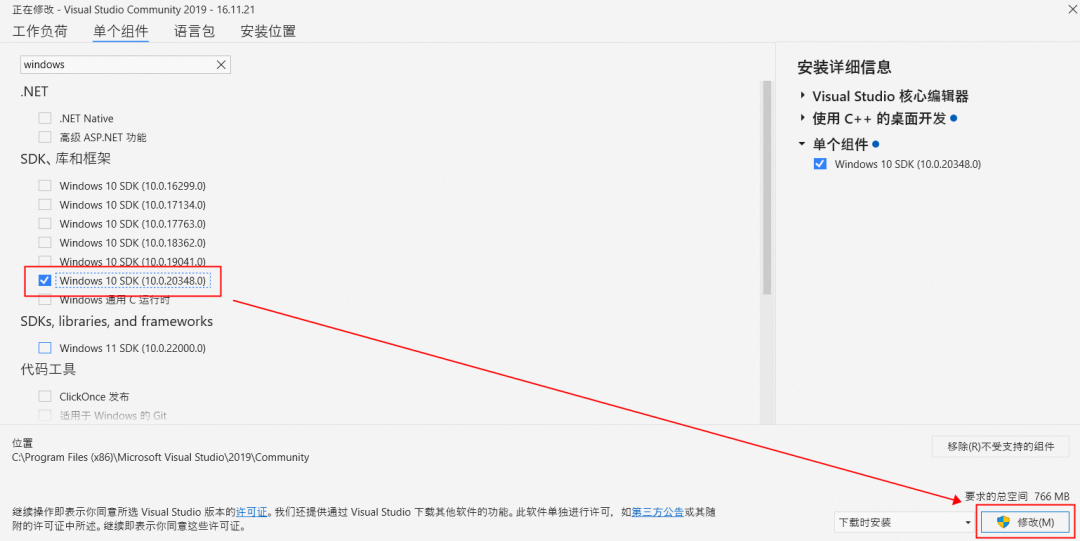
接着选择单个组件,把报错信息中提示要安装的 Windows 10 SDK(注意版本号)勾选上并点击“修改”按钮进行安装:
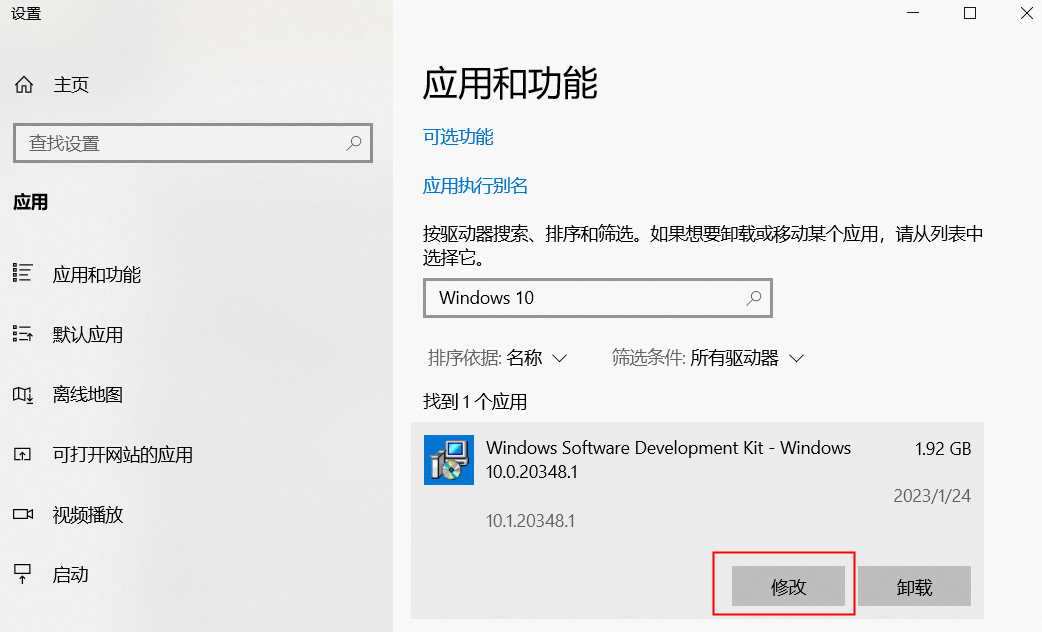
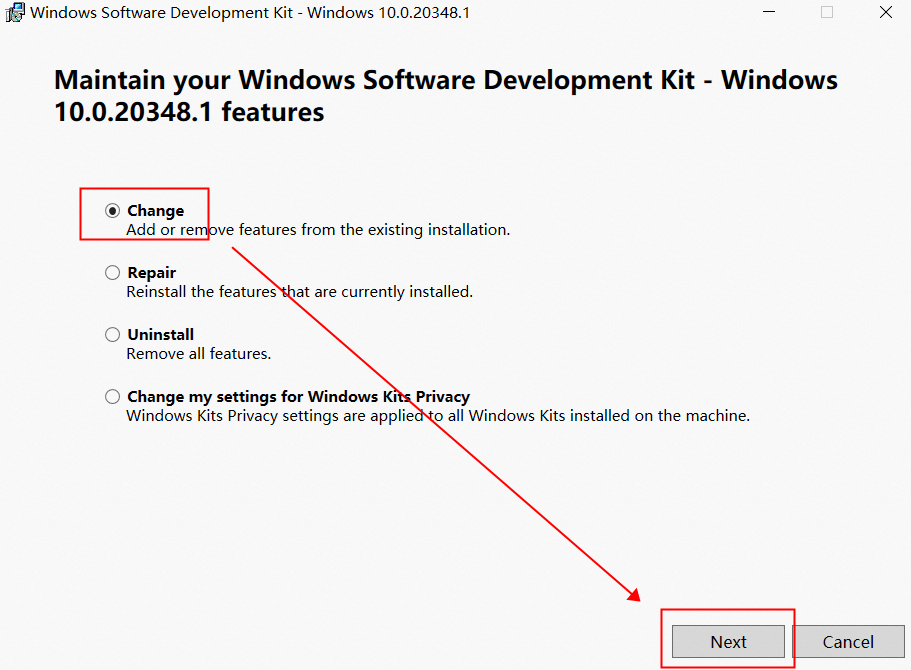
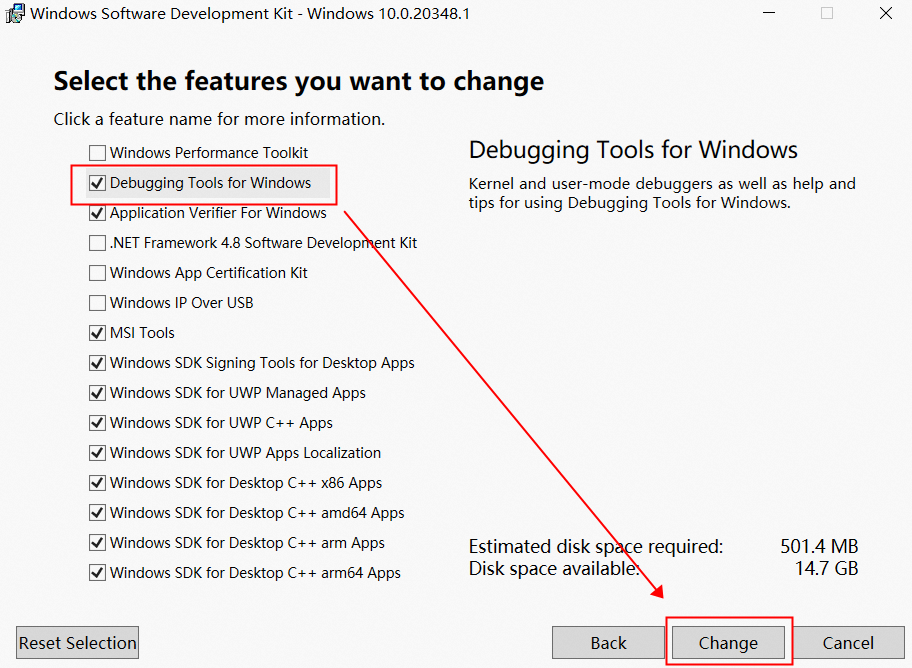
由于 Visual Studio Installer 安装的 Windows 10 SDK 不包含 Debugging Tools for Windows,所以安装完成后还不能继续执行指令 。我们还要打开系统设置中的“应用和功能”选项并找到刚刚安装的 Windows 10 SDK,点击“修改”按钮后在弹出界面中选择 Change 选项并点击 Next 按钮,选中 Debugging Tools for Windows,然后点击 Change 按钮。
若报了 "AssertionError: user32.lib is not found in LIB" 的错误,则解决方法如下:
Traceback (most recent call last):
File "D:/workspace/electron/src/build/toolchain/win/setup_toolchain.py", line 314, in <module>
main()
File "D:/workspace/electron/src/build/toolchain/win/setup_toolchain.py", line 274, in main
vc_lib_um_path = FindFileInEnvList(env, 'LIB', ';', 'user32.lib')
File "D:/workspace/electron/src/build/toolchain/win/setup_toolchain.py", line 212, in FindFileInEnvList
assert optional, "%s is not found in %s:\n%s\nCheck if it is installed." % (
AssertionError: user32.lib is not found in LIB:
C:\Program Files (x86)\Microsoft Visual Studio\2019\Community\VC\Tools\MSVC\14.29.30133\ATLMFC\lib\x64
C:\Program Files (x86)\Microsoft Visual Studio\2019\Community\VC\Tools\MSVC\14.29.30133\lib\x64
C:\Program Files (x86)\Windows Kits\10\lib\10.0.20348.0\ucrt\x64
C:\Program Files (x86)\Windows Kits\10\lib\10.0.19041.0\um\x64
Check if it is installed.
ERROR at //build/config/win/BUILD.gn:310:27: Script returned non-zero exit code.
vcvars_toolchain_data = exec_script("../../toolchain/win/setup_toolchain.py",
^----------
Current dir: D:/workspace/electron/src/out/Release/
Command: D:/workspace/depot_tools/bootstrap-2@3_8_10_chromium_26_bin/python3/bin/python3.exe D:/workspace/electron/src/build/toolchain/win/setup_toolchain.py "C:\Program Files (x86)\Microsoft Visual Studio\2019\Community" "C:\Program Files (x86)\Windows Kits\10" "C:\Windows\System32;C:\Windows\SysWOW64;Arm64Unused" win x64 none
Returned 1.
See //build/config/BUILDCONFIG.gn:437:35: which caused the file to be included.
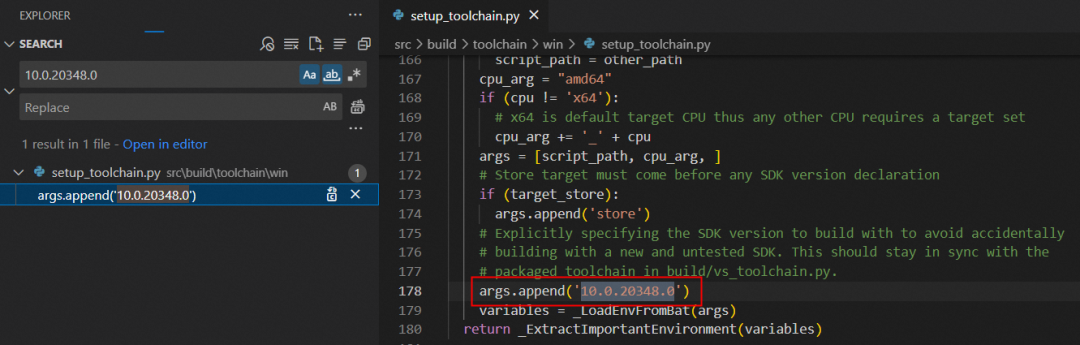
default_executable_configs += [ "//build/config/win:cfi_linker" ]把 src\build\toolchain\win\setup_toolchain.py 第178 行的 Windows 10 SDK 版本 "10.019041.0" 修改为我们刚刚安装的 "10.0.20348.0" 版本即可。
经过这些步骤修改完成后,就可以继续执行上述指令了。执行成功后再执行下面的指令就开始正式构建 Electron 源码,由于这个指令要编译链接 4 万多个文件,因此会花费更长的时间。建议可以在睡觉前跑该指令,等第二天醒来就可以在 src/out/Testing 目录下找到我们自己编译生成的 electron.exe 可执行程序及相关的二进制资源了。
> ninja -C out/Testing electron -j 4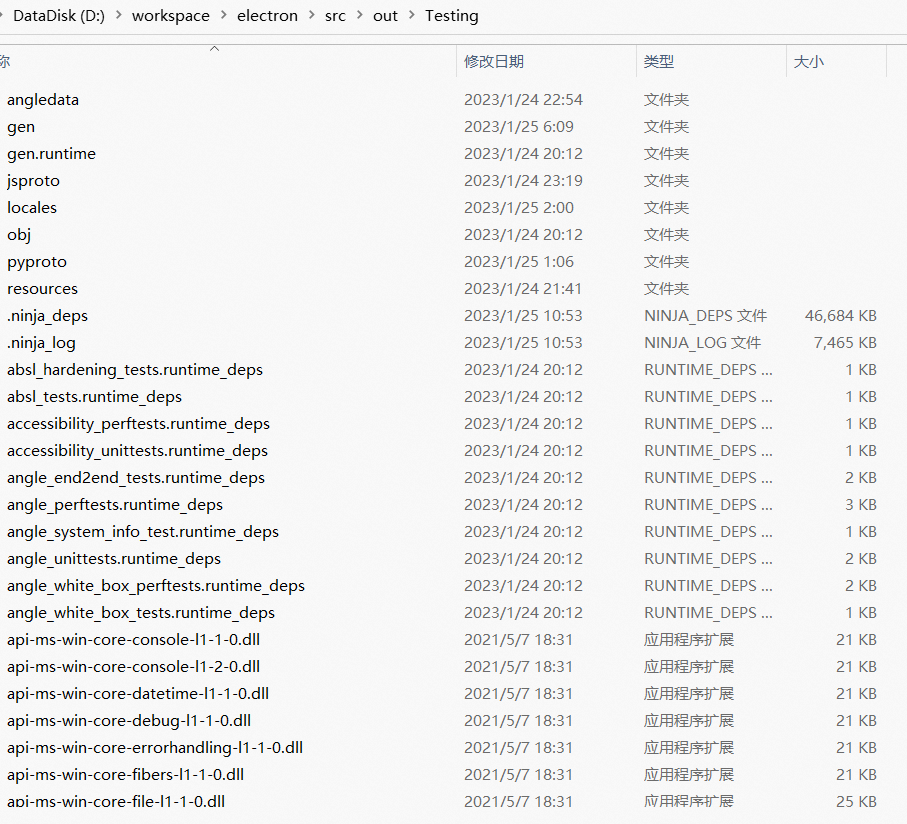
构建 release 版本的 Electron
在上一章节中,我们使用 build/args/testing.gn 脚本构建了 Electron 源码,然后在 src/out/Testing 目录下就会生成非常多的 dll、lib、exe 等文件。由于 Chromium 项目极其庞大,编译、链接工作往往需要耗费大量的时间,于是 Chromium 引入了分块构建的技术,将每个模块作为单独的动态库进行构建,这样就能大大加快编译、链接的速度。
我们除了可以使用 build/args/testing.gn 构建 Electron 源码外,还可以使用 build/args/release.gn 脚本构建 release 版本的 Electron。通过下面指令编译、链接 Electron 源码后,src\out\Release 目录下就会输出 release 版本的 Electron 编译结果。
> cd src
> set CHROMIUM_BUILDTOOLS_PATH=%cd%\buildtools
> gn gen out/Release --args="import(\"//electron/build/args/release.gn\")"
> ninja -C out/Release electron -j 4
默认情况下,在编译前 gclient 获取的是 nightly 分支的 Electron 源码,获取源码的指令如下:
> gclient config --name "src/electron" --unmanaged https://github.com/electron/electron
> gclient sync --with_branch_heads --with_tags
这是 Electron 开发团队日常工作时使用的分支,而我们一般需要 main 分支或 18-x-y 这种具体某个版本的分支,因此需要通过下面 git 命令来切换 src/electron 目录下的分支:
切换 main 分支
> cd src/electron
> git remote remove origin
> git remote add origin https://github.com/electron/electron
> git checkout main
> git branch --set-upstream-to=origin/main
> git pull
切换 18-x-y 分支
> cd src/electron
> git remote remove origin
> git remote add origin https://github.com/electron/electron
> git checkout 18-x-y
> git branch --set-upstream-to=origin/18-x-y
> git pull
切换完 Electron 源码分支后,务必执行下面的命令拉取新 Electron 源码分支所依赖的 Chromium、node.js 等源码(gclient 会检查 src/electron 目录下的 DEPS 文件,从中获取依赖信息)。
> gclient sync -f接着再使用 “ninja -C out\Release electron -j 4” 指令就可以编译我们期望的某个版本分支(如 18-x-y 分支)的 Electron 版本了。若编译过程遇到下面报错信息,可以直接看解决方法。
若报了 "To rebaseline" 的错误,可能与 XFG(eXtended Flow Guard:拓展控制流防护)有关,按照提示执行 copy 命令即可。
To rebaseline:
  copy /y C:\Users\kelai\AppData\Local\Temp\tmpgx2zcmac\* D:\workspace\electron\src\third_party\win_build_output\midl\third_party\isimpledom\ISimpleDOMDocument.idl\x64
ninja: build stopped: subcommand failed.
若报了 "error: use of undeclared identifier 'PROC_THREAD_ATTRIBUTE_COMPONENT_FILTER'" 的错误,则打开 src\sandbox\win\src\startup_information_helper.cc 文件并注释掉 131 行的 if 语句块代码(不要注释 "expected_attributes--;" 这一行代码,否则处理属性时会出错)。
../../sandbox/win/src/startup_information_helper.cc(132,13): error: use of undeclared identifier 'PROC_THREAD_ATTRIBUTE_COMPONENT_FILTER'
            PROC_THREAD_ATTRIBUTE_COMPONENT_FILTER, &component_filter_,
            ^
1 error generated.
[7/24935] CXX obj/components/paint_preview/common/mojom/mojom/paint_preview_recorder.mojom.obj
ninja: build stopped: subcommand failed.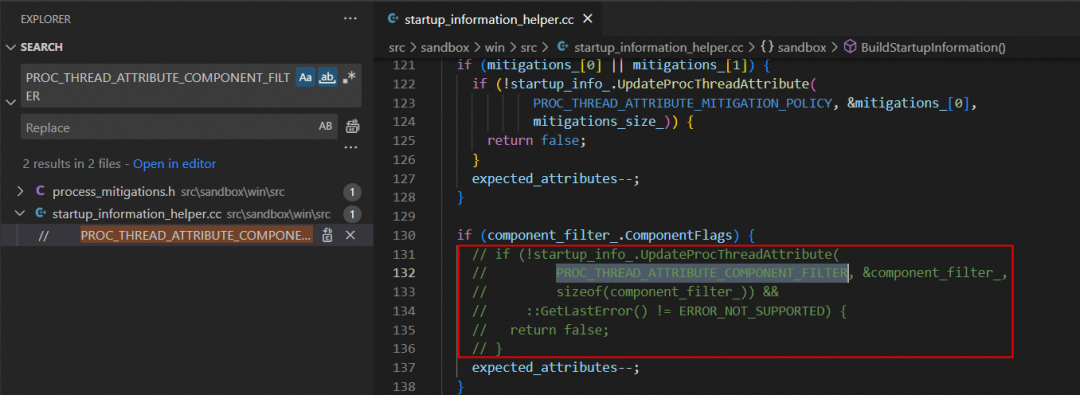
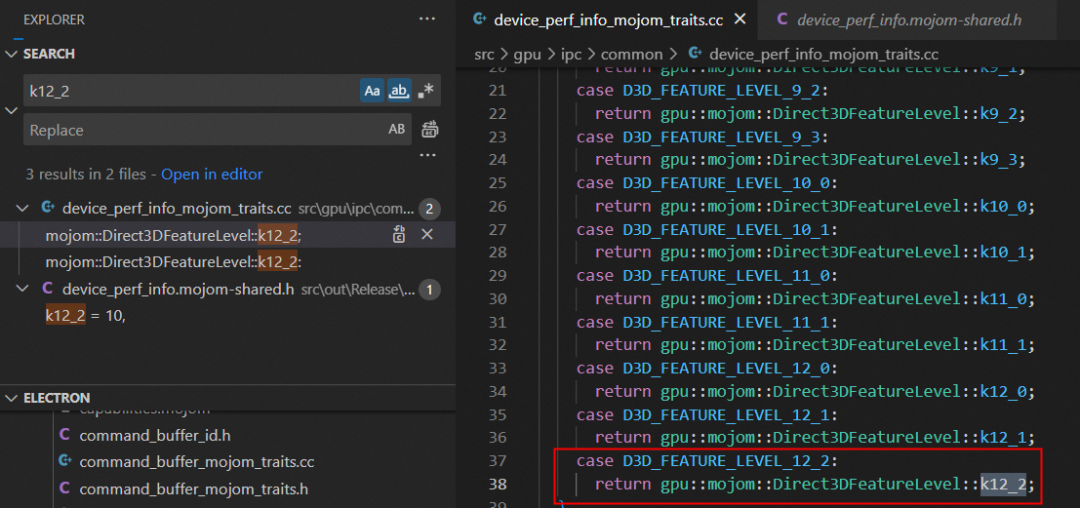
若报了 "error: enumeration value 'D3D_FEATURE_LEVEL_12_2' not handled in switch [-Werror,-Wswitch]" 的错误,是因为 D3D_FEATURE_LEVEL_12_2 是在 10.0.20170.0 的 SDK 中才添加进来,需要做如下修改:
../../gpu/ipc/common/device_perf_info_mojom_traits.cc(16,11): error: enumeration value 'D3D_FEATURE_LEVEL_12_2' not handled in switch [-Werror,-Wswitch]
switch (d3d_feature_level) {
^~~~~~~~~~~~~~~~~
1 error generated.
[939/19937] ACTION //third_party/blink/public/mojom:mojom_platform__generator(//build/toolchain/win:win_clang_x64)
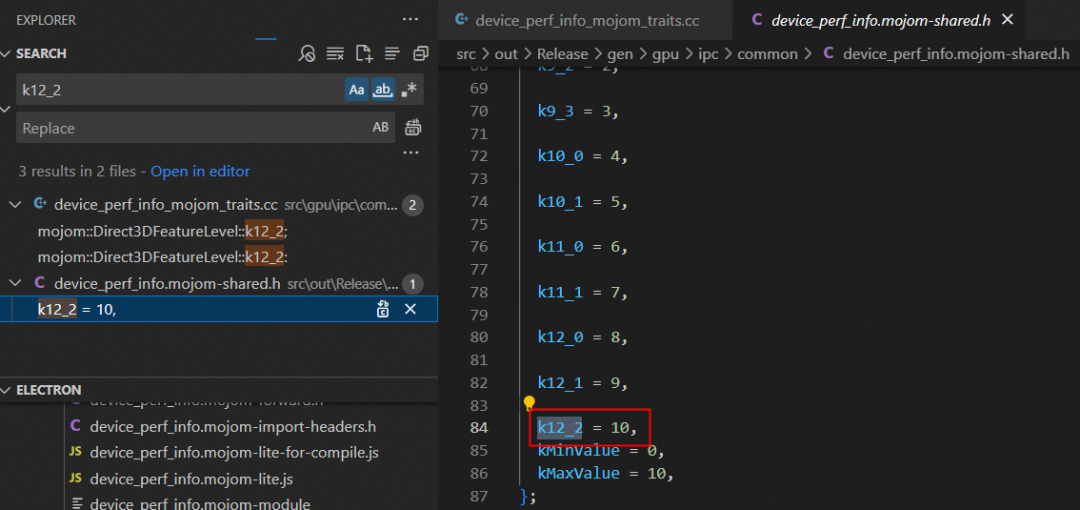
ninja: build stopped: subcommand failed.首先打开 src\gpu\ipc\common\device_perf_info_mojom_traits.cc 文件在第 37 行添加下面代码:
接着打开 src\gpu\ipc\common\device_perf_info_mojom_traits.cc 文件在第 79 行添加下面代码:
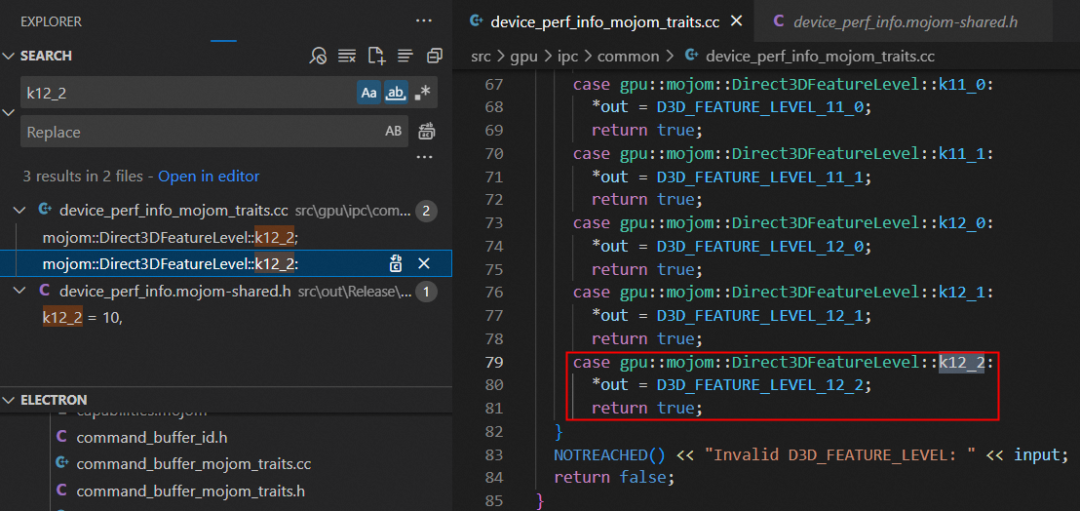
最后打开 src\gpu\ipc\common\device_perf_info.mojom 文件在第 84 行添加下面代码:
若报了 "error: enumeration value 'AudioEffectType_FarFieldBeamForming' not handled in switch [-Werror,-Wswitch]" 的错误,则打开 src\media\audio\win\audio_low_latency_input_win.cc 文件第 195 行添加下面代码:
../../media/audio/win/audio_low_latency_input_win.cc(158,11): error: enumeration value 'AudioEffectType_FarFieldBeamForming' not handled in switch [-Werror,-Wswitch]
  switch (type) {
          ^~~~
1 error generated.
[2536/19159] CXX obj/media/formats/formats/dts_stream_parser.obj
ninja: build stopped: subcommand failed.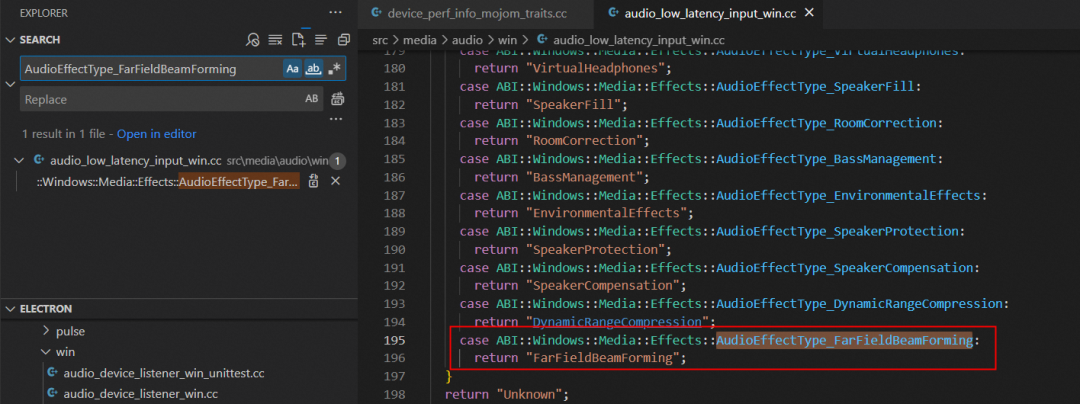
若报了 "error: redefinition of '_DXVA_*_AV1'" 的错误,则打开 src\media\gpu\windows\d3d11_AV1_accelerator.cc 文件并删除两个 #pragma 及之间的所有内容:
../../media/gpu/windows/d3d11_av1_accelerator.cc(273,16): error: redefinition of '_DXVA_Tile_AV1'
typedef struct _DXVA_Tile_AV1 {
               ^
C:\Program Files (x86)\Windows Kits\10\include\10.0.20348.0\um\dxva.h(1745,16): note: previous definition is here
typedef struct _DXVA_Tile_AV1 {
               ^
3 errors generated.
[1274/16624] CXX obj/media/gpu/gpu/d3d11_h264_accelerator.obj
ninja: build stopped: subcommand failed.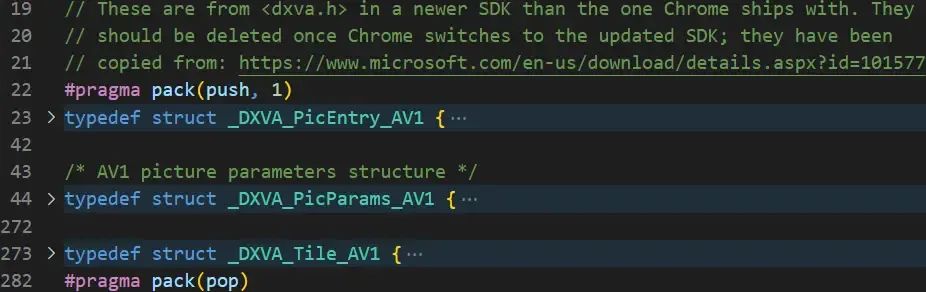
解决完编译过程遇到的上面几个问题后,继续编译直到控制台输出 "STAMP obj/electron/electron.stamp" 日志时才表明编译成功,并且也会在 src\out\Release 目录下生成很多无用的文件,如下图所示:
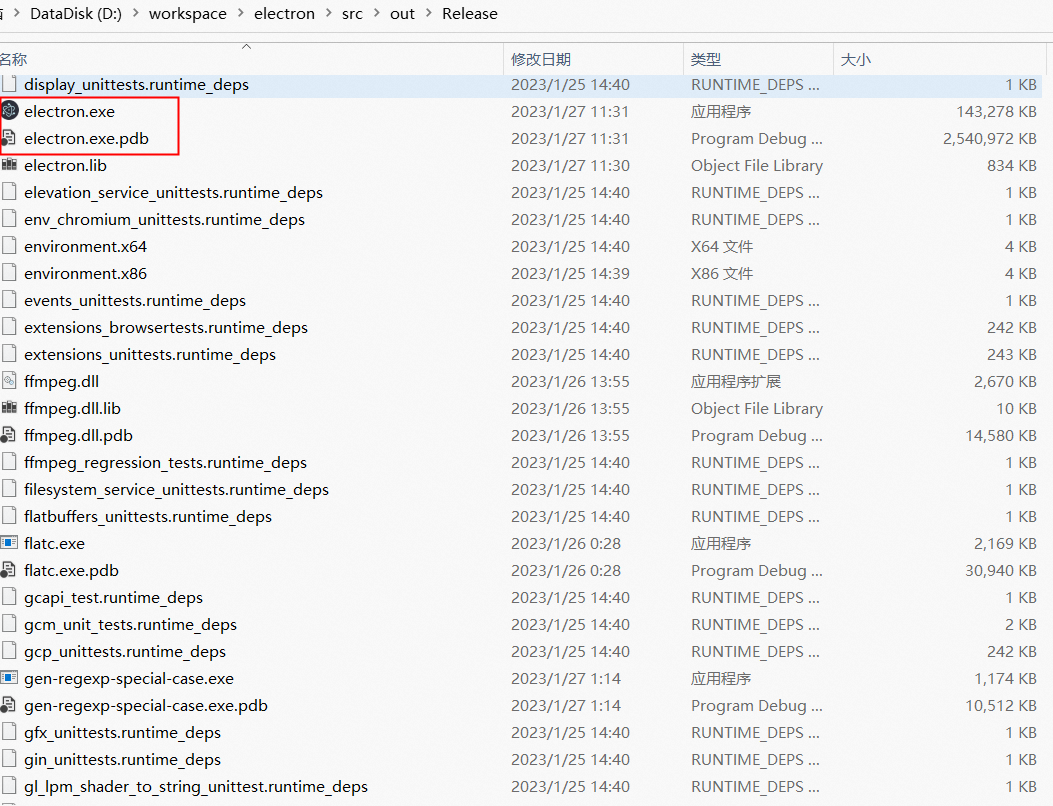
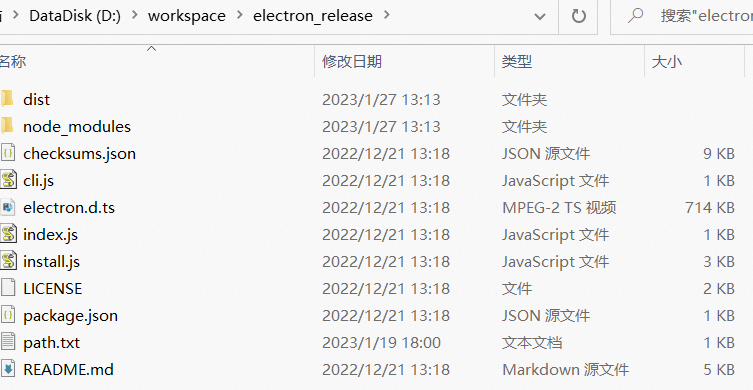
其实,我们只要按照 Electron 团队发布的文件(参照 node_modules\electron\dist 目录下的文件)从 src\out\Release 目录下挑选出来即可,最终分发给用户的也只是这些文件,其他文件都是不需要的。
接下来我们开始介绍如何构建突破 v8 堆内存上限的 Electron 版本。
构建突破 v8 堆内存上限的 Electron 版本
早在 2014 年,Chrome 为了更好的安全性、稳定性和性能,就把 32 位进程切换为 64 位进程。但这样带来的副作用是每个指针从 4 个提升到 8 个字节,导致消耗了更多的内存。数据显示,在桌面端应用中 v8 占 Chrome 渲染器进程内存消耗的 60%。因此,v8 一直努力减少内存开销,在 v9.2 版本时通过将 64 位指针分为两半(其中高 32 位是基数,低 32 位是该基数的索引)来实现指针压缩,以尝试尽可能多地取回浪费的 4 个字节。
|----- 32 bits -----|----- 32 bits -----|
Pointer:    |________base_______|_______index_______|
其中 v8 实现指针压缩的源码分析如下所示:
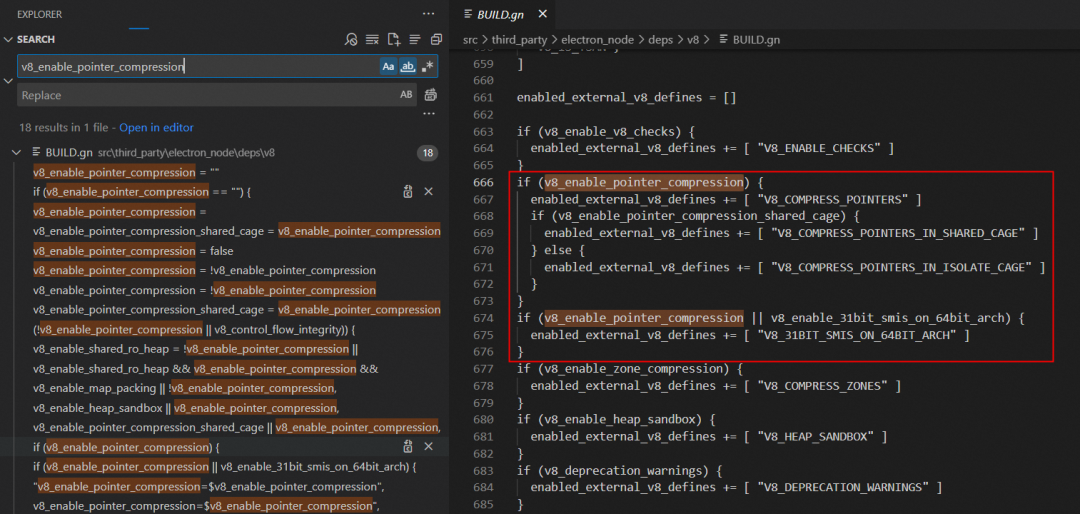
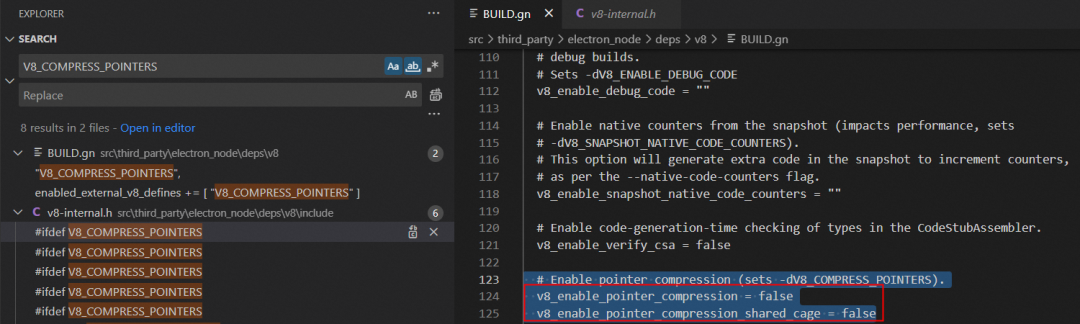
首先打开 src\third_party\electron_node\deps\v8\BUILD.gn 文件,默认 v8_enable_pointer_compression 和 v8_enable_pointer_compression_shared_cage 变量为空,若 v8_current_cpu 为 64位(arm64 是 arm 中 64 位体系结构,x64 是 x86 系列中的 64 位体系结构,如下图电脑是 x64)则 v8_enable_pointer_compression 和 v8_enable_pointer_compression_shared_cage 变量都被赋值为 true,然后 enabled_external_v8_defines 新增 V8_COMPRESS_POINTERS 的定义。
# Enable pointer compression (sets -dV8_COMPRESS_POINTERS).
v8_enable_pointer_compression = ""
v8_enable_pointer_compression_shared_cage = ""
v8_enable_31bit_smis_on_64bit_arch = false


if (v8_enable_pointer_compression == "") {
  v8_enable_pointer_compression =
      v8_current_cpu == "arm64" || v8_current_cpu == "x64"
}
if (v8_enable_pointer_compression_shared_cage == "") {
  v8_enable_pointer_compression_shared_cage = v8_enable_pointer_compression
}


if (v8_enable_pointer_compression) {
  enabled_external_v8_defines += [ "V8_COMPRESS_POINTERS" ]
  if (v8_enable_pointer_compression_shared_cage) {
    enabled_external_v8_defines += [ "V8_COMPRESS_POINTERS_IN_SHARED_CAGE" ]
  } else {
    enabled_external_v8_defines += [ "V8_COMPRESS_POINTERS_IN_ISOLATE_CAGE" ]
  }
}
if (v8_enable_pointer_compression || v8_enable_31bit_smis_on_64bit_arch) {
  enabled_external_v8_defines += [ "V8_31BIT_SMIS_ON_64BIT_ARCH" ]
}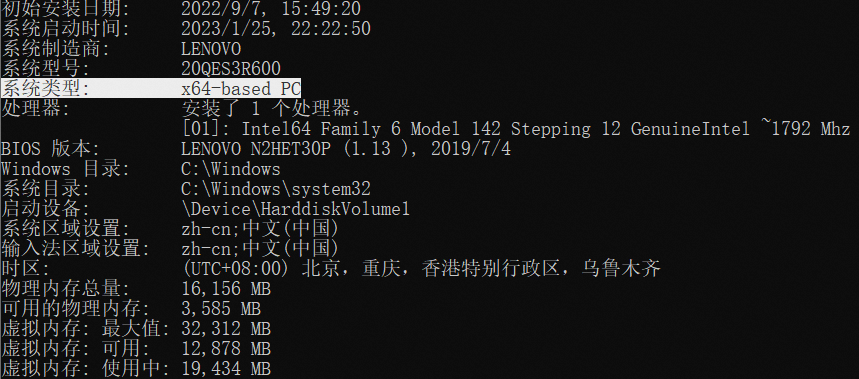
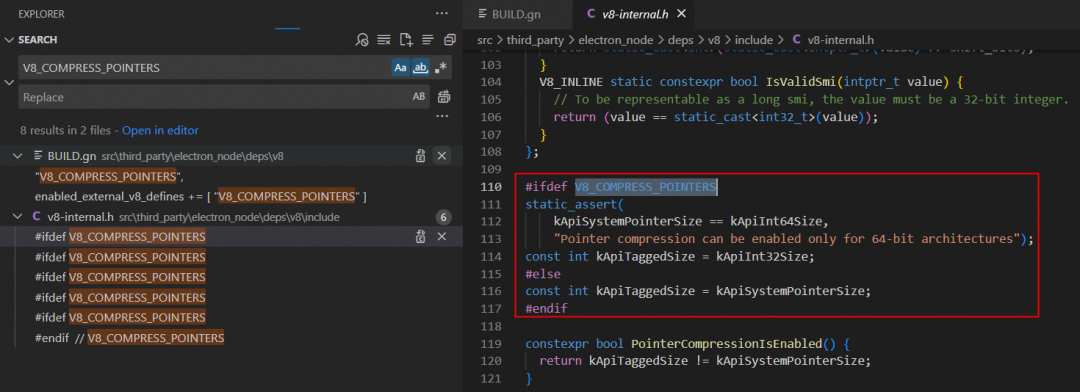
接着打开 src\third_party\electron_node\deps\v8\include\v8-internal.h 文件,因为前面定义了 V8_COMPRESS_POINTERS,那么 kApiTaggedSize 就会等于 4个字节大小的 kApiInt32Size(否则等于系统指针大小,cpu x64 则为 8 个字节大小),这就是 v8 实现指针压缩的原理。
/**
 * Configuration of tagging scheme.
 */
const int kApiSystemPointerSize = sizeof(void*);
const int kApiDoubleSize = sizeof(double);
const int kApiInt32Size = sizeof(int32_t);
const int kApiInt64Size = sizeof(int64_t);


#ifdef V8_COMPRESS_POINTERS
static_assert(
    kApiSystemPointerSize == kApiInt64Size,
    "Pointer compression can be enabled only for 64-bit architectures");
const int kApiTaggedSize = kApiInt32Size;
#else
const int kApiTaggedSize = kApiSystemPointerSize;
#endif
经过指针压缩后显著减少了内存消耗并提高了性能,但代价是 v8 将同一个进程中所有线程所使用的堆内存大小限制为 4GB。由于 Electron 对外发布版本默认打开了指针压缩,为了突破 v8 申请的堆内存上限,我们需要设置参数禁止指针压缩,并重新编译 Electron 版本,具体操作步骤如下:
首先打开 src\electron\build\args\all.gn 文件,添加下面的代码:
# Disable pointer compression
v8_enable_pointer_compression = false
v8_enable_pointer_compression_shared_cage = false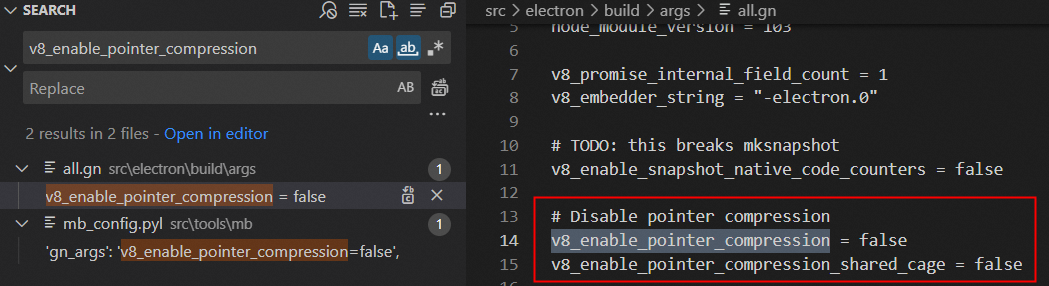
接着打开 src\third_party\electron_node\deps\v8\BUILD.gn 文件,把 v8_enable_pointer_compression 和 v8_enable_pointer_compression_shared_cage 变量都赋值为 false,关闭指针压缩功能。
最后在控制台执行下面指令重新编译 Electron 版本,等编译成功后 v8 就能突破 4GB 堆内存大小限制了。
> cd src
> set CHROMIUM_BUILDTOOLS_PATH=%cd%\buildtools
> gn gen out/Release_disable_v8_pointer_compression --args="import(\"//electron/build/args/release.gn\")"
> ninja -C out/Release_disable_v8_pointer_compression electron -j 4
默认情况下,64 位操作系统 v8 可以申请 8GB 堆内存。我们可以打印 performance.memory 看下 v8 堆内存最大可申请大小,如下所示:
▐ 构建后清除代理设置
构建完成后,如果你想要清除掉前面为代理做的一系列设置,可以执行如下命令:
清除 git 代理:
> git config --global --unset http.proxy
> git config --global --unset https.proxy
清除 npm 代理:
> npm config delete proxy
> npm config delete https-proxy
清除 gclient 代理:
> set http_proxy=
> set https_proxy=
清除系统代理:
> C:\Windows\system32>netsh
> netsh>winhttp
> netsh winhttp>
> netsh winhttp>reset proxy
如何用 Memory 和 Performance 工具分析内存泄漏问题
前面提到,我们可以通过编译 8G 堆内存的 Electron 版本来缓解 V8FatalErrorCallback 崩溃问题,但这种解决方案会带来以下几个副作用:
享受不了 v8 指针压缩带来的好处,会额外增加至少 40% 的内存开销。
自行编译 Electron 版本后,需要定期维护更新升级,存在潜在的风险。
无法彻底解决 V8FatalErrorCallback 崩溃问题。
因此,我们还是要透过现象去分析问题发生的本质原因。对于客户端应用使用过程中 v8 堆内存一直持续增长问题,根本原因是因为内存泄漏导致。那有人就会问了,v8 不是会自动帮我们 GC 垃圾回收不再使用的内存吗?为啥还会一直持续增长呢?
我们先来看下内存泄漏的定义:当进程不再需要某些内存时,依然没办法回收这些内存。在 JavaScript 中,造成内存泄漏的主要原因是不再需要的内存数据仍然被其他对象引用着。也就是说,这些内存数据里的对象不再使用但引用计数不为 0 导致无法被 GC,造成内存泄漏。
那要如何定位排查出哪块代码导致的内存泄漏呢?我们可以使借助 chrome devtools 提供的 Memory 和 Performance 工具来分析内存泄漏问题。
▐ 如何用 Memory 工具分析内存泄漏问题
我们首先可以通过 Memory 工具,从内存中对象的角度来分析内存泄漏。
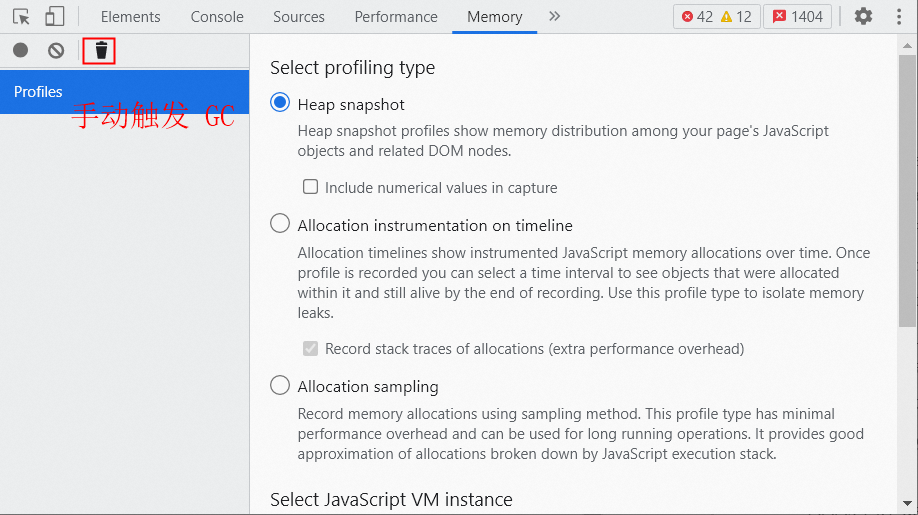
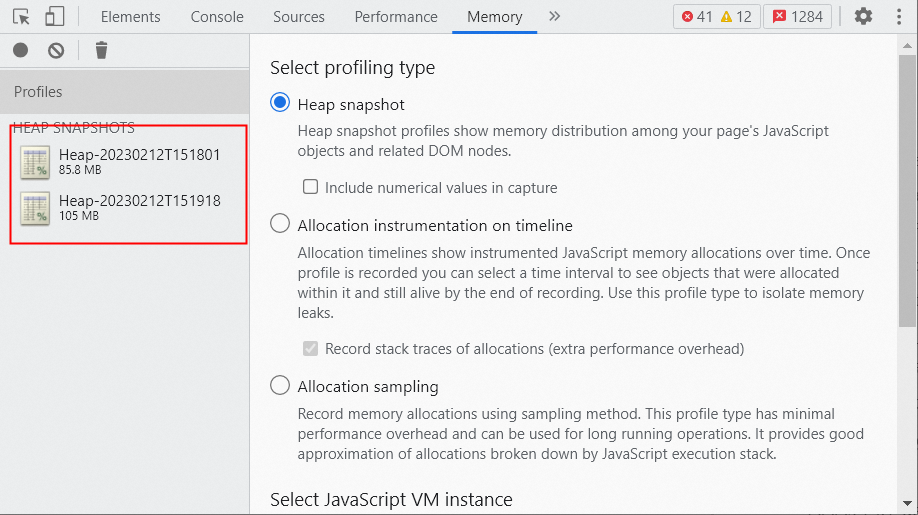
首先点击 chrome Memory 面板下的垃圾回收按钮,手动触发一次 GC:
然后录制一次内存快照,过一段时间(如 1min)后再录制一次内存快照。通过这两次内存快照可以得知内存增长了 19.2M,存在内存泄漏的问题。
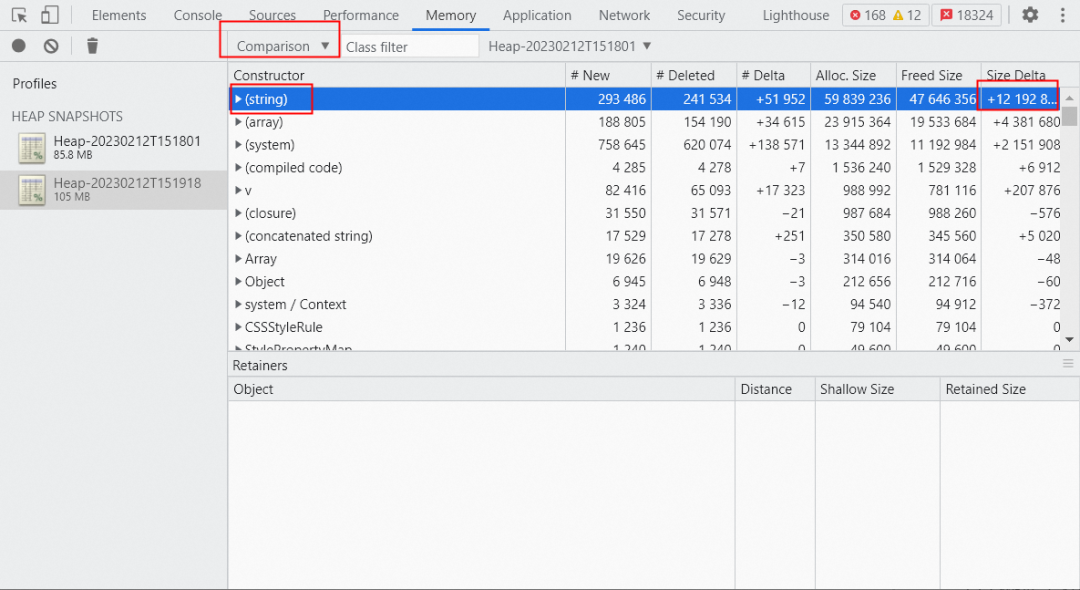
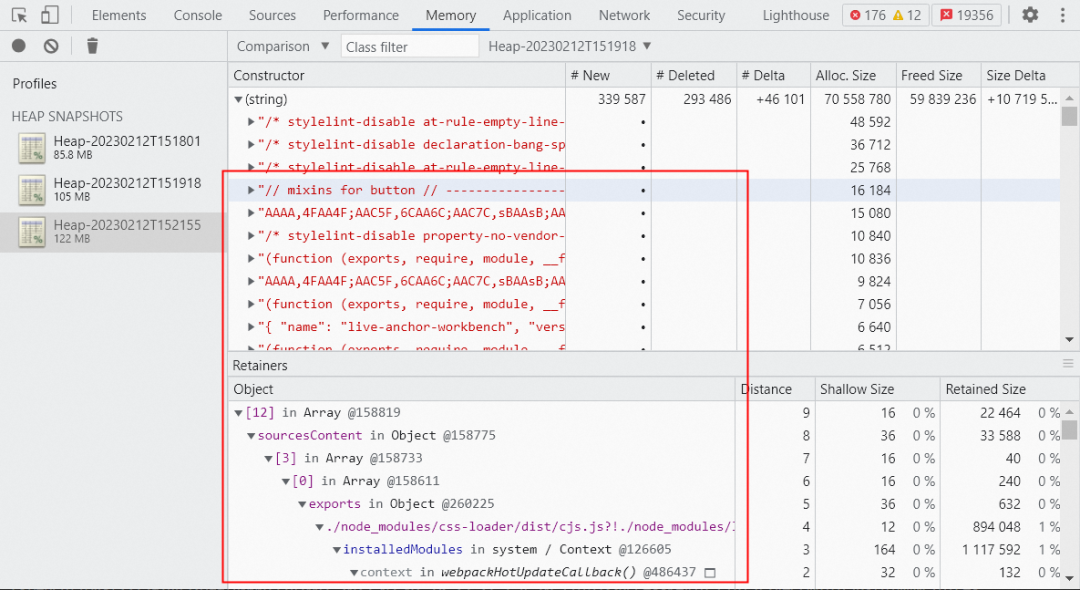
继续对比 diff 这两次内存快照,发现最大的内存增长是 string 对象。但点 string tab 展开后并不能直接定位到是哪块代码逻辑导致,只能去排查到底哪里在频繁使用string 对象导致的内存泄漏,定位问题不够直观。
▐ 如何用 Performance 工具分析内存泄漏问题
因此,我们还需要通过 Performance 工具,从代码的角度来分析内存泄漏。
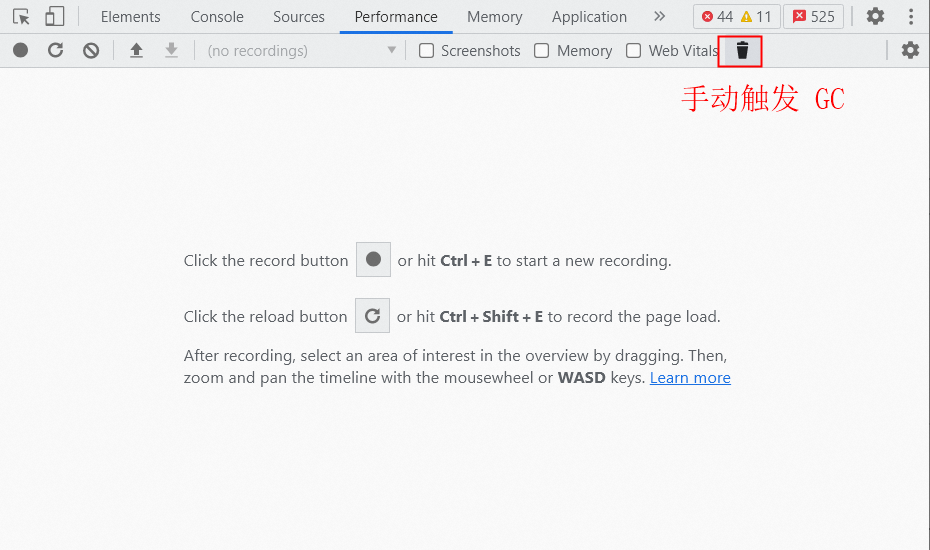
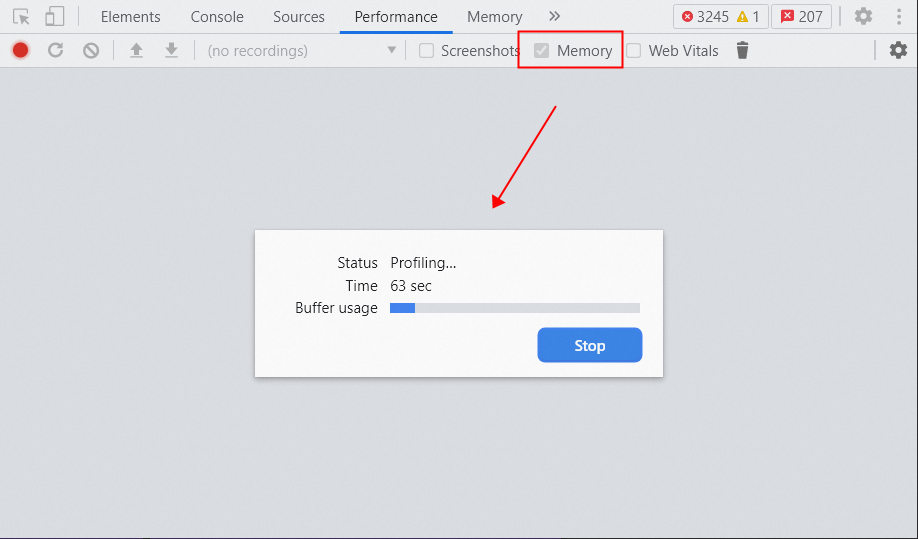
首先点击 chrome Performance 面板下的垃圾回收按钮,手动触发一次 GC:
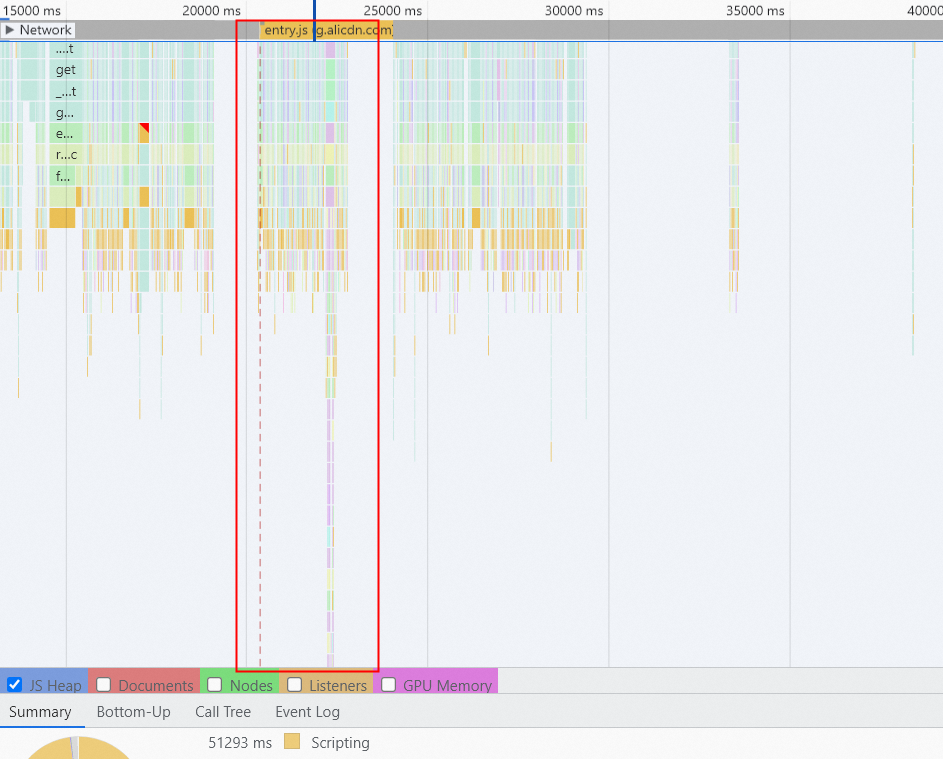
然后勾选 chrome Performance 面板下的 Memory 选项,点击录制按钮开始录制,等录制一段时间(如 1 分钟)后停止录制:
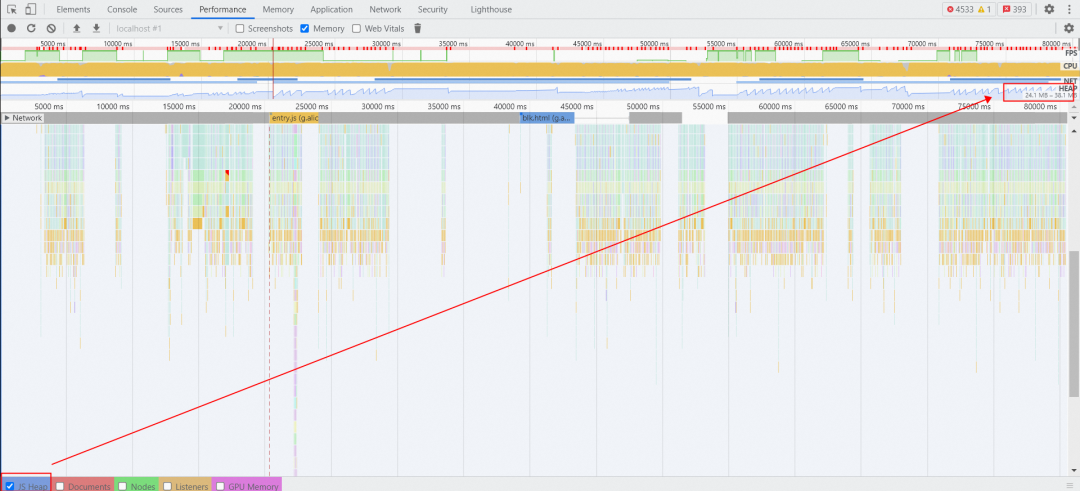
接着查看 chrome Performance 面板下的内存部分,只勾选 JS Heap 看下内存是否有增长趋势。下图显示内存从 24.1M 一直增长到 38.1M,说明存在内存泄漏。
紧接着点击内存分配情况的某个点,就会定位到 Performance 中的某个任务的代码。
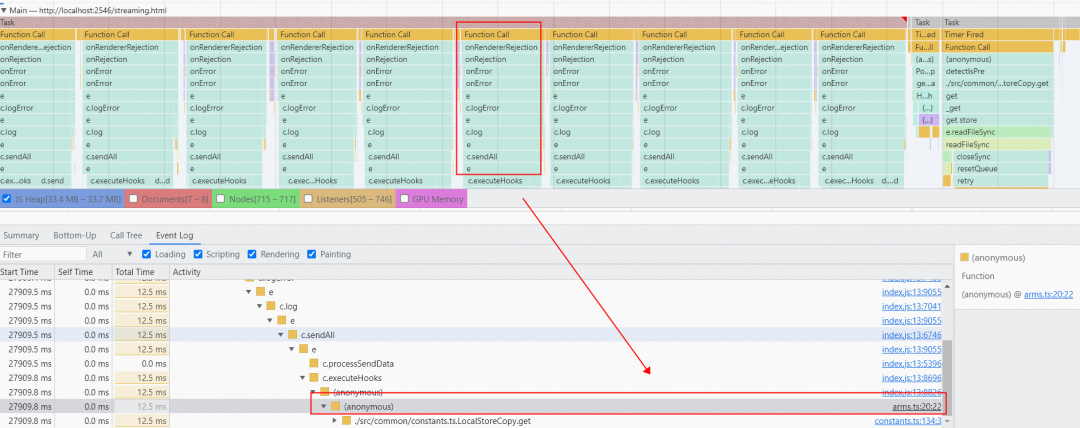
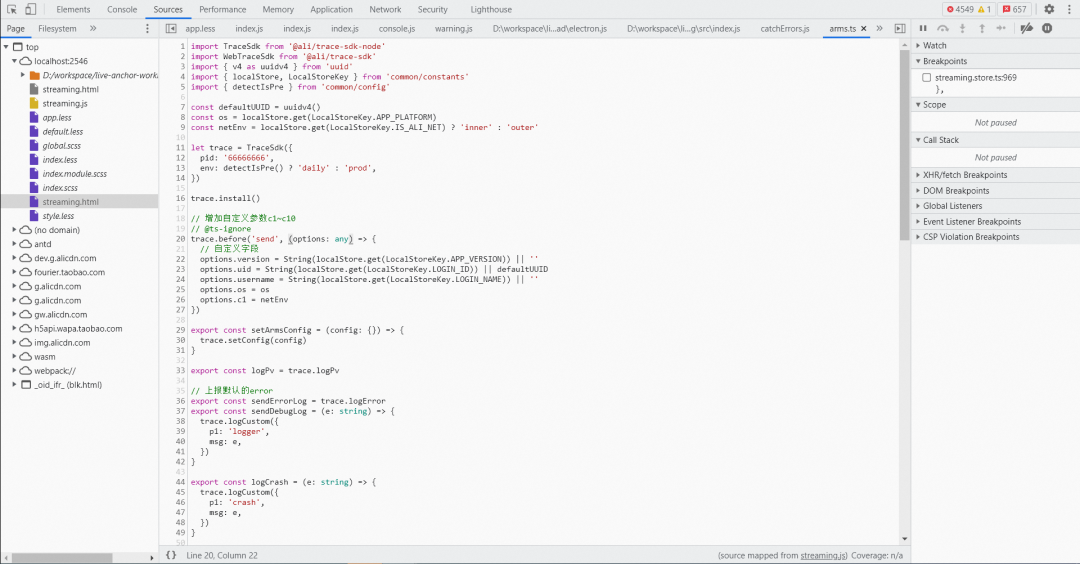
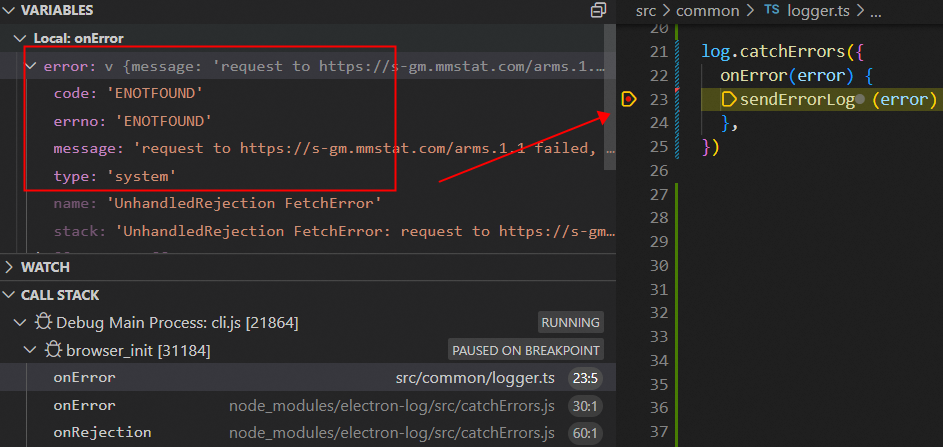
最后点击某个任务代码可以定位到分配内存的代码,分析后发现是一直在触发 electron-log 的 onError 事件,具体的应用代码如下:
import TraceSdk from '@ali/trace-sdk-node'
import log from 'electron-log'


// arms 实时日志上报平台
let trace = TraceSdk()
const sendErrorLog = trace.logError


log.catchErrors({
  onError(error) {
    sendErrorLog(error)
  },
})
通过查看 V8FatalErrorCallback 这类崩溃用户日志发现崩溃前一直在上报 FetchError 的错误信息:
Unhandled Exception FetchError: request to https://s-gm.mmstat.com/arms.1.1 failed, reason: getaddrinfo ENOTFOUND s-gm.mmstat.com
    at ClientRequest.<anonymous> (http://localhost:2546/home.js:7090:298490)
    at ClientRequest.emit (node:events:390:28)
    at TLSSocket.socketErrorListener (node:_http_client:447:9)
    at TLSSocket.emit (node:events:390:28)
    at emitErrorNT (node:internal/streams/destroy:157:8)
    at emitErrorCloseNT (node:internal/streams/destroy:122:3)
    at processTicksAndRejections (node:internal/process/task_queues:83:21)
另外看下面的调用堆栈猜测可能是主进程被挂起或断网导致 arms 实时日志上报请求会一直失败,然后就会递归触发 electron-log 的 onError 事件:
为了验证这个猜想,我们尝试断网后用 vscode 断点调试发现确实如此,难怪用 Memory 工具对比分析前后一段时间的内存 heapsnapshot 时发现 string 和 array 对象一直在增长,是因为 error 里持有了错误信息的字符串。
既然定位到原因了,那解决起来也很简单,就是把 arms fetchError 这类错误日志过滤掉。不仅可以解决递归 onError 事件导致的内存泄漏问题,还可以过滤由于 arms 本身带来的错误日志。
import TraceSdk from '@ali/trace-sdk-node'
import log from 'electron-log'


// arms 实时日志上报平台
let trace = TraceSdk()
const sendErrorLog = trace.logError


log.catchErrors({
  onError(error) {
    // 过滤 arms fetch error 错误日志
    if (!error?.message.includes('https://s-gm.mmstat.com/arms')) {
      sendErrorLog(error)
    }
  },
})
排查这么久,V8FatalErrorCallback js heap OOM 崩溃问题终于破案了。工欲善其事必先利其器,不得不说 chrome devtools 的 Memory 和 Performance 工具对分析内存泄漏问题太有帮助了。

如何监控 v8 堆内存泄漏问题
上一章节我们通过借助 chrome devtools 的 Memory 和 Performance 工具手动分析了 1 例内存泄漏问题,但可能还存在其他如全局变量、变量被闭包引用、游离的 DOM 元素被变量引用、定时器没清除等隐藏的内存泄漏问题。当客户端应用发布后,我们要如何监控线上 v8 堆内存泄漏问题呢?
▐ 如何监控 v8 实时堆内存使用趋势
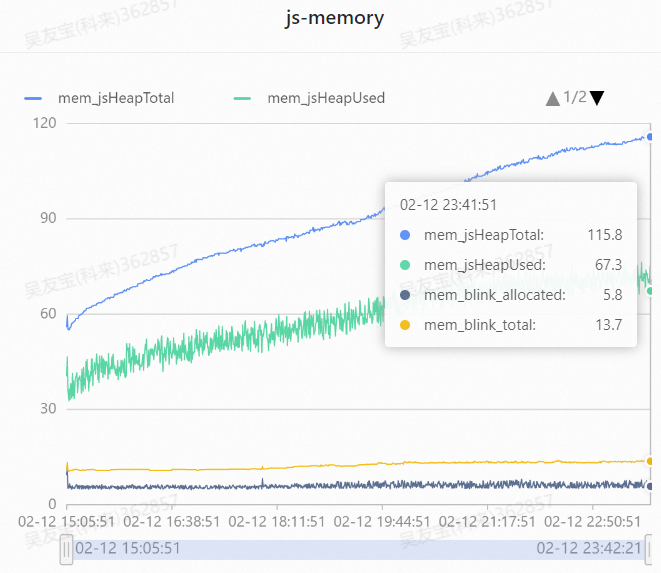
首先我们可以通过 v8.getHeapStatistics 接口,每隔一段时间(如 1 分钟)采集一次 v8 的堆内存数据,然后上报到 Medialab平台进行监控,实时统计 v8 堆内存使用趋势,下图可以明显发现 v8 堆内存使用一直在增长,存在内存泄漏问题。
▐ 如何监控 v8 堆内存泄漏问题
除了用 v8.getHeapStatistics 接口实时监控 v8 堆内存使用趋势外,我们还可以用 node-memwatch npm 包查找代码中的内存泄漏问题。
node-memwatch 可以监听两个事件:
stats:GC 事件,每执行一次 GC 都会触发该函数并打印 heap 相关的信息,如下所示:
{
  num_full_gc: 1,// 完整的垃圾回收次数
  num_inc_gc: 1,// 增长的垃圾回收次数
  heap_compactions: 1,// 内存压缩次数
  usage_trend: 0,// 使用趋势
  estimated_base: 5350136,// 预期基数
  current_base: 5350136,// 当前基数
  min: 0,// 最小值
  max: 0// 最大值
}
leak:内存泄露事件,触发该事件的条件是:连续 5 次 GC 后内存都是增长的,如下所示:
{
  growth: 4051464,
  reason: 'heap growth over 5 consecutive GCs (2s) - -2147483648 bytes/hr'
}
当监听到 leak 内存泄漏事件时,我们可以通过 HeapDiff 来对比分析前后内存快照,以此排查具体是哪个对象发生了内存泄漏。
{
  "before": { "nodes": 11625, "size_bytes": 1869904, "size": "1.78 mb" },
  "after":  { "nodes": 21435, "size_bytes": 2119136, "size": "2.02 mb" },
  "change": { "size_bytes": 249232, "size": "243.39 kb", "freed_nodes": 197,
    "allocated_nodes": 10007,
    "details": [
      { "what": "String",
        "size_bytes": -2120,  "size": "-2.07 kb",  "+": 3,    "-": 62
      },
      { "what": "Array",
        "size_bytes": 66687,  "size": "65.13 kb",  "+": 4,    "-": 78
      },
      { "what": "LeakingClass",
        "size_bytes": 239952, "size": "234.33 kb", "+": 9998, "-": 0
      }
    ]
  }
}
总结
本文从 Electron V8FatalErrorCallback 崩溃问题的堆栈分析开始讲起,然后通过堆栈信息一步步使用各种解决方案都无功而返后,尝试分析 v8 源码堆内存限制的实现原理,并开始编译关闭指针压缩的 Electron 源码来提升 v8 堆内存上限以此来延缓问题。但由于该方案会额外带来一些副作用被否掉,最终借助 chrome devtools 提供的 Memory 和 Performance 工具一步步排查定位才解决了 Electron v8 引发的内存 OOM 问题。最后我们通过 v8.getHeapStatistics 来监控 v8 堆内存趋势、node-memwatch 来监控 v8 堆内存是否有泄漏,可以触类旁通解决其他内存 OOM 问题。

团队介绍
我们是大淘宝技术淘宝直播前端团队,负责淘系增长非常快的直播业务,业务上升空间非常大。在技术方面,我们在探索直播间互动、游戏互动、数据可视化、音视频播放器、微前端、智能搭建、Web 3D、Electron跨端开发、桌面推流客户端开发、跨 PC/H5/Native 的多端架构等。在这里你有机会通过一行代码为业务创造亿级 GMV 增量,期待优秀的你!
¤ 拓展阅读 ¤