祝大家数学建模竞赛都能取得好成绩~
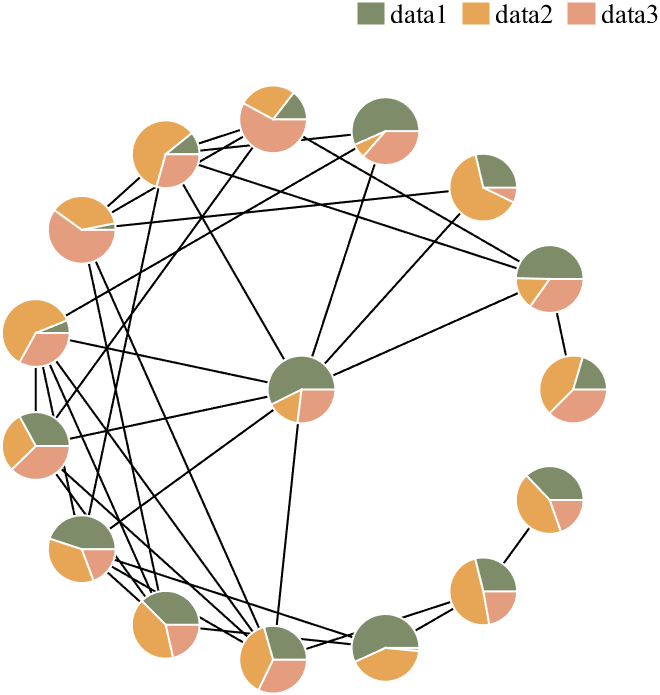
嘿,真的真的好久不见了,前段时间属实是太忙了,今天给大家带来一篇如何绘制将节点替换为饼图的网络图,大概长这样:

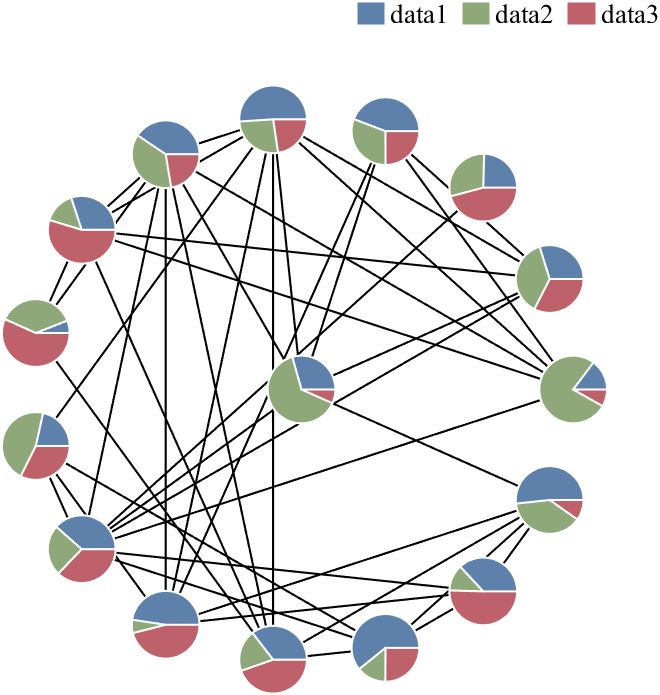
还是非常帅气的,以下先讲原理再给出完整代码:
基础教程
0 数据准备
这里先讲如果数据是起始终止点数组咋办,之后会提一下如果数据是邻接矩阵形式咋办:
S=[1 1 1 1 1 6 6 6 6 6 11 11 11];
T=[2 3 4 5 6 7 8 9 10 11 12 13 14];
R=rand(3,14);
% 自定义了点配色RGB 0-1
CList=[0.3686    0.5059    0.6745
    0.5608    0.6588    0.4784
    0.7490    0.3804    0.4157
    0.9059    0.8235    0.0078
    0.4902    0.3255    0.1608
    0.9569    0.5843    0.2196
    0.4000    0.8039    0.6667
    0.8157    0.4392    0.7255
    0.5961    0.9843    0.5961
    0.9882    0.6392    0.7176];
这里S是起始点数组,T是终止点数组,R是用来绘制饼图的数据,CList顾名思义就是配色。
1 基础网络构建
% 使用MATLAB自带函数构建网络
fig1=figure();
G=graph(S,T);
GHdl=plot(G,'Layout','force');
X=GHdl.XData;
Y=GHdl.YData;
XY=[X(:),Y(:)];
close(fig1)
就是画个网络图获取一下网络图各个节点坐标后再关掉:

2 网络图重绘
重新开个figure使用黑线重绘:
% 新图窗创建及坐标区域修饰
fig2=figure('Units','normalized','Position',[.2,.2,.4,.6]);
ax=gca;
ax.DataAspectRatio=[1,1,1];
ax.XColor='none';
ax.YColor='none';
L=pdist2(XY,XY);
L(~~eye(size(L,1)))=inf;
L=min(min(L)).*.3;

% 重绘网络图
hold on
LX=[X(S);X(T);S.*nan];
LY=[Y(S);Y(T);S.*nan];
plot(LX(:),LY(:),'LineWidth',1,'Color','k');

3 添加饼图
% 绘制饼图
R=R./sum(R,1);
Theta=cumsum([zeros(1,size(R,2));R]).*2.*pi;
Tt01=linspace(0,1,50);
for i=1:size(R,2)
    for k=1:size(R,1)
        Tt=(Theta(k+1,i)-Theta(k,i)).*Tt01+Theta(k,i);
        PHdl=fill([X(i),cos(Tt).*L+X(i)],[Y(i),sin(Tt).*L+Y(i)],CList(k,:),'EdgeColor','w','LineWidth',1);
        if i==1,PltHdl(k)=PHdl;end
    end
end

4 添加图例
% 绘制图例
lgdHdl=legend(PltHdl,'Box','off','FontName','Times New Roman',...
    'FontSize',13,'Orientation','horizontal','Location','best');
lgdHdl.ItemTokenSize=[14,14];

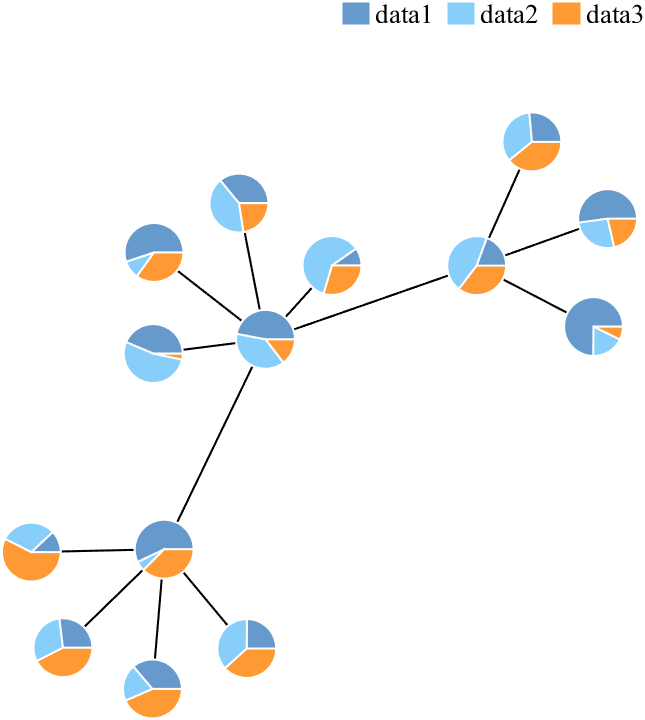
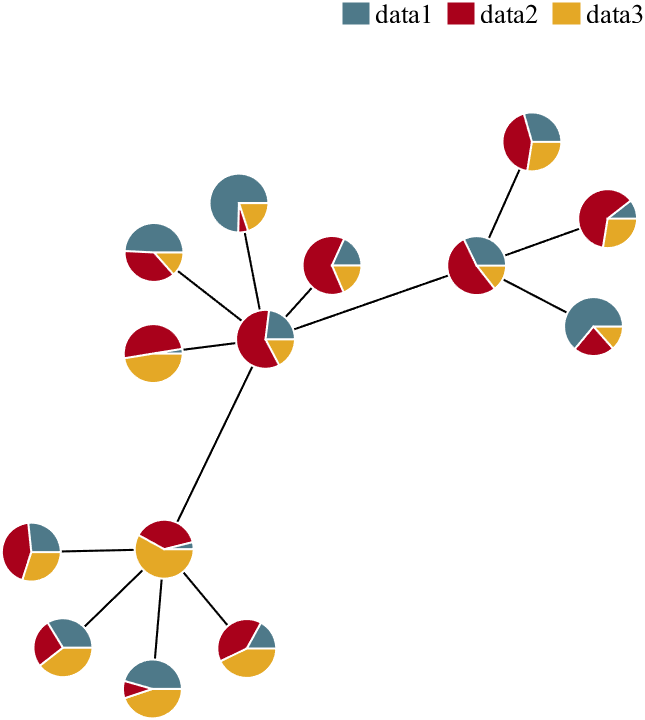
5 修改配色
这里多提供几种好看的配色,更多配色可以从这篇https://slandarer.blog.csdn.net/article/details/129828666中的slanCL工具获取:
CList=[0.5490 0.5490 0.5490
0.5333 0.7412 0.9020
0.9843 0.6980 0.3451
0.5647 0.8039 0.5922
0.9647 0.6667 0.7882
0.7490 0.6471 0.3294
0.7373 0.6000 0.7804
0.9294 0.8667 0.2745
0.9412 0.4941 0.4314];
CList=[0.4000 0.6000 0.8000
0.5294 0.8078 0.9804
1.0000 0.6000 0.2000
0.4000 0.6000 0.8000
0.5294 0.8078 0.9804
1.0000 0.4000 0
0.8000 0.8000 1.0000
0.5294 0.8078 0.9804
1.0000 0.6000 0.2000];
CList=[0.4941 0.5490 0.4118
0.9059 0.6510 0.3333
0.8980 0.6157 0.4980
0.8902 0.5137 0.4667
0.4275 0.2824 0.2784];
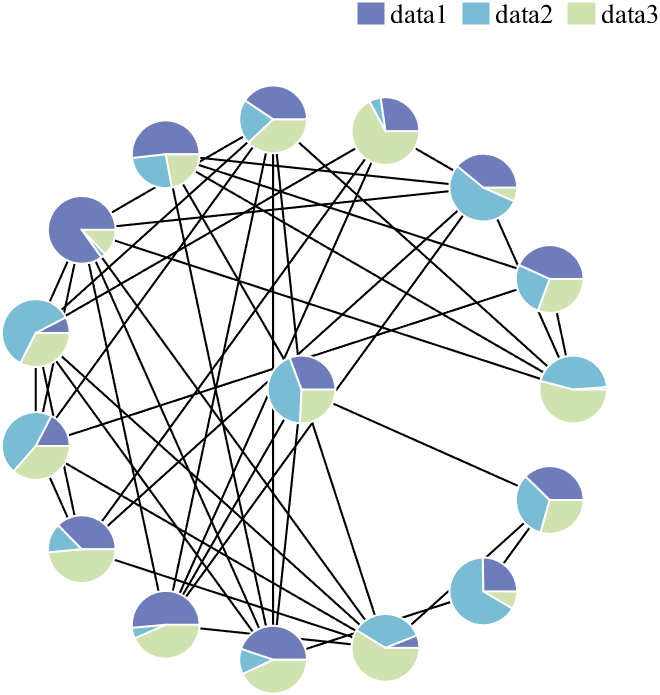
CList=[0.4314 0.4863 0.7255
0.4824 0.7373 0.8353
0.8157 0.8863 0.6863
0.9608 0.8588 0.6000
0.9098 0.6118 0.5059
0.8235 0.5176 0.5529];
CList=[0.4000 0.7725 0.8000
0.9647 0.8118 0.4431
0.9725 0.6118 0.4549
0.8627 0.6902 0.9490
0.5294 0.7725 0.3725
0.6196 0.7255 0.9529
0.9961 0.5333 0.6941
0.7882 0.8588 0.4549
0.5451 0.8784 0.6431
0.7059 0.5922 0.9059
0.8275 0.7059 0.5176
0.7020 0.7020 0.7020];
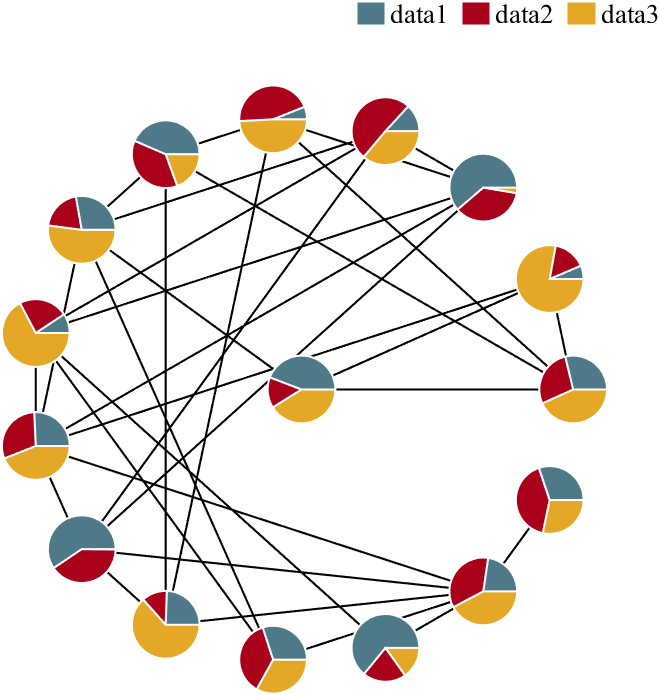
CList=[0.3059 0.4745 0.5373
0.6627 0.0039 0.1059
0.8941 0.6588 0.1490
0.5020 0.5804 0.3059
0.8627 0.8392 0.6980];


完整代码(起始终止点数组)
%@author : slandarer
S=[1 1 1 1 1 6 6 6 6 6 11 11 11];
T=[2 3 4 5 6 7 8 9 10 11 12 13 14];
R=rand(3,14);
% 自定义了点配色RGB 0-1
CList=[0.3686    0.5059    0.6745
    0.5608    0.6588    0.4784
    0.7490    0.3804    0.4157
    0.9059    0.8235    0.0078
    0.4902    0.3255    0.1608
    0.9569    0.5843    0.2196
    0.4000    0.8039    0.6667
    0.8157    0.4392    0.7255
    0.5961    0.9843    0.5961
    0.9882    0.6392    0.7176];

% 使用MATLAB自带函数构建网络
fig1=figure();
G=graph(S,T);
GHdl=plot(G,'Layout','force');
X=GHdl.XData;
Y=GHdl.YData;
XY=[X(:),Y(:)];
close(fig1)

% 新图窗创建及坐标区域修饰
fig2=figure('Units','normalized','Position',[.2,.2,.4,.6]);
ax=gca;
ax.DataAspectRatio=[1,1,1];
ax.XColor='none';
ax.YColor='none';
L=pdist2(XY,XY);
L(~~eye(size(L,1)))=inf;
L=min(min(L)).*.3;

% 重绘网络图
hold on
LX=[X(S);X(T);S.*nan];
LY=[Y(S);Y(T);S.*nan];
plot(LX(:),LY(:),'LineWidth',1,'Color','k');

% 绘制饼图
R=R./sum(R,1);
Theta=cumsum([zeros(1,size(R,2));R]).*2.*pi;
Tt01=linspace(0,1,50);
for i=1:size(R,2)
    for k=1:size(R,1)
        Tt=(Theta(k+1,i)-Theta(k,i)).*Tt01+Theta(k,i);
        PHdl=fill([X(i),cos(Tt).*L+X(i)],[Y(i),sin(Tt).*L+Y(i)],CList(k,:),'EdgeColor','w','LineWidth',1);
        if i==1,PltHdl(k)=PHdl;end
    end
end

% 绘制图例
lgdHdl=legend(PltHdl,'Box','off','FontName','Times New Roman',...
    'FontSize',13,'Orientation','horizontal','Location','best');
lgdHdl.ItemTokenSize=[14,14];
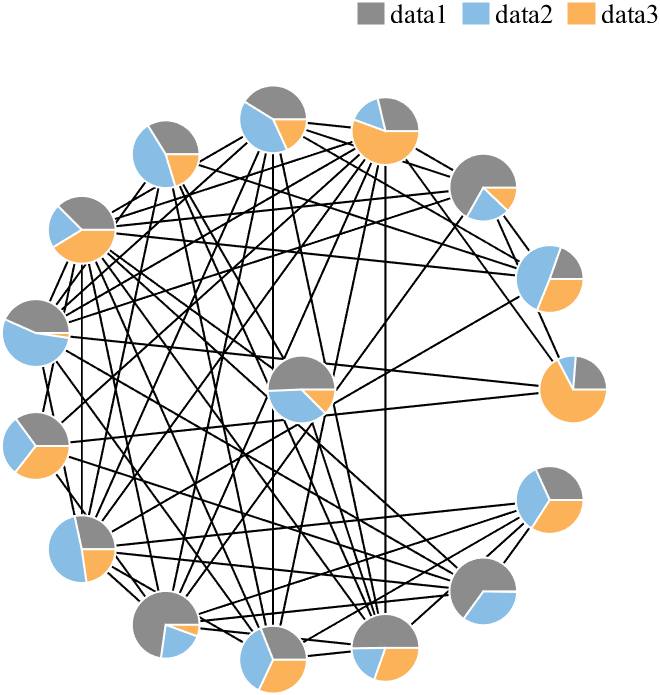
完整代码(邻接矩阵)
使用graph函数创建完对象后,直接获取其Edges.EndNodes属性作为S及T矩阵即可,相信聪明的大家应该能看懂~:
% 随机生成邻接矩阵
A=rand(16)>.8;
A=(A+A')./2;
A(~~eye(size(A)))=0;
R=rand(3,16);
% 自定义了点配色RGB 0-1
CList=[0.3686    0.5059    0.6745
    0.5608    0.6588    0.4784
    0.7490    0.3804    0.4157
    0.9059    0.8235    0.0078
    0.4902    0.3255    0.1608
    0.9569    0.5843    0.2196
    0.4000    0.8039    0.6667
    0.8157    0.4392    0.7255
    0.5961    0.9843    0.5961
    0.9882    0.6392    0.7176];
% 使用MATLAB自带函数构建网络
fig1=figure();
G=graph(A);
GHdl=plot(G,'Layout','circle','Center',1);
S=G.Edges.EndNodes(:,1).';
T=G.Edges.EndNodes(:,2).';
X=GHdl.XData;
Y=GHdl.YData;
XY=[X(:),Y(:)];
close(fig1)

% 新图窗创建及坐标区域修饰
fig2=figure('Units','normalized','Position',[.2,.2,.4,.6]);
ax=gca;
ax.DataAspectRatio=[1,1,1];
ax.XColor='none';
ax.YColor='none';
L=pdist2(XY,XY);
L(~~eye(size(L,1)))=inf;
L=min(min(L)).*.3;

% 重绘网络图
hold on
LX=[X(S);X(T);S.*nan];
LY=[Y(S);Y(T);S.*nan];
plot(LX(:),LY(:),'LineWidth',1,'Color','k');

% 绘制饼图
R=R./sum(R,1);
Theta=cumsum([zeros(1,size(R,2));R]).*2.*pi;
Tt01=linspace(0,1,50);
for i=1:size(R,2)
    for k=1:size(R,1)
        Tt=(Theta(k+1,i)-Theta(k,i)).*Tt01+Theta(k,i);
        PHdl=fill([X(i),cos(Tt).*L+X(i)],[Y(i),sin(Tt).*L+Y(i)],CList(k,:),'EdgeColor','w','LineWidth',1);
        if i==1,PltHdl(k)=PHdl;end
    end
end

% 绘制图例
lgdHdl=legend(PltHdl,'Box','off','FontName','Times New Roman',...
    'FontSize',13,'Orientation','horizontal','Location','best');
lgdHdl.ItemTokenSize=[14,14];


完
以上以及是完整代码,若日后代码有更新可在以下gitee仓库查看:
https://gitee.com/slandarer/spdraw/