一、描述
在做语音分割时,需要音频文件的波形图。
二、代码如下
import librosa
import librosa.display as ld
import matplotlib.pyplot as plt

# Load audio file
audio_file = 'SA1.WAV'
y, sr = librosa.load(audio_file)

# Plot waveform
plt.figure(figsize=(14, 5))
librosa.display.waveshow(y, sr=sr)
plt.title('Waveform')
plt.xlabel('Time (s)')
plt.ylabel('Amplitude')
plt.show()
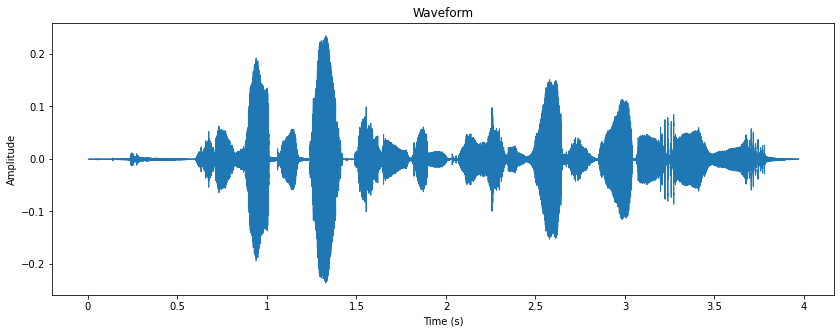
三、效果图