PDFormer: Propagation Delay-Aware Dynamic Long-Range Transformer for Traffic Flow Prediction
Abstract
As a core technology of Inteligent Transportation System, traffic flow prediction has a wide range of application. The fundamental challenge in traffic flow prediction is to effictely model the complex spatial-temporal dependencies in traffic data.
Spatial-temporal Graph Neural Network(GNN) models have emerged as one of the most promising methods to solve this problem.
However, GNN-based models have three major limitations for traffic predication:
- Most methods model spatial dependencies in a static manner, which limits the ablility to learn dynamic urban traffiic pattern;
- “Static manner”: 静态建模指的是一种静态的方式或方法,即假设在一个特定的时间点内空间上的依赖关系是固定不变的。
- 这些图卷积类的方法依赖与静态的图结构,“静态建模”则表示这些方法认为这些关系是不变的,也就是说,在时间上没有任何变化或者演化。因此,这些方法不能捕捉到空间依赖性关系的动态变化,可能不适合需要考虑空间关系的动态变化的应用场景。
- 所以限制了动态的城市交通模式的学习。
- Most methods only consider short-range spatial infermation and are unable to capture long-range spatial dependencis;
- 大部分方法只考虑 短范围的空间关系,无法获取较长范围的的空间依赖关系。
- These methods ignore the fact that the propagation of traffic conditions between locations has a time delay in traffice systems.
-
propagation : 传播
-
traffice condition: 交通状况
-
这些方法忽略了这样一个事实:在交通系统中,不同地点之间交通状况的传播具有一定的延时性。
To this end, we propose a novel Propagation Delay-aware dynamic long-range transFormer, namely PDFormer, for accurate traffice long-range prediction. Specifically, we design a spatial self-attention module to capture the dynamic spatial dependencies. Then, two graph masking matrices are introduced to hignlight spatial dependencies from short-and long-range views. -
我们提出了一个 新的 Delay-aware, dynamic long-range Transformer, 叫做PDFormer.
-
我们设计了自注意力机制来捕获动态的空间依赖
-
使用两个图 masking metrices 来强调 短距离和长距离的空间依赖,
猜测可能是对长距离和短距离的节点进行加权处理,后面回来验证。
Moreover, a traffic delay-aware feature transformation module is proposed to empower PDFormer with the capability of explicity.
- delay-aware feature transformation 可以显示增强 PDFormer的性能
Extensive experimental results on six real-world public traffic datasets show that our method can not only archive state-of-the-art perfermance but also exhibit competitive computational efficiency.Moreover, we visualize the learned spatial-temporal attention map to make our model highly interprtable.
- 在 6个交通数据上达到了sota
- 表现出较好的计算效率
- 可视化了时空注意力图,来使得模型具有较好的解释性。
Introduction
In recent years, rapid urbanization has posed great challenges to modern urban traffic management. As an indispensable part of model smart cities. 应用场景后面回来看
For traffic flow prediction, the fundamental challenge is to effiecively caputure and model the complex and dynamic spatial-temporal dependencies of traffic data.
Many attenpts have been made in the literature to develop various deep learning models for this task. As early solutions, convolutional neural networks(CNNs) were applied to grid-based traffic data to capture spatial dependencies, and recurrent neural networks(RNNs) were used to learn temporal dyanamic.
graph neural networks(GNNs) were shown to be more suited to model the underlying graph structure of traffic data, and thus GNN-based methods have been widely explored in traffic prediction.
Despite the effectiveness, GNN-based models still have three major limitations for traffic prediction.
First, the spatial dependecies between locations in a traffic system are highly dynamic instead of being static,which are time-varying as they are affected by travel patterns and unexpected events. For example, as shown in Fig.1(b), the correlation between nodes A and B becomes stronger during the morning peek and weaker during other periods. While, existing methods model spatial dependencies mainly in a static manner(either perdefine or self-learned), which limits the ablility to learn dynamic urban traffic patterns.Secondly, due to the function division of the city, two distant locations, such as nodes A and C in Fig.1©, may reflect similar traffic pattens, implying the spatial dependencies between locaions as long-range.
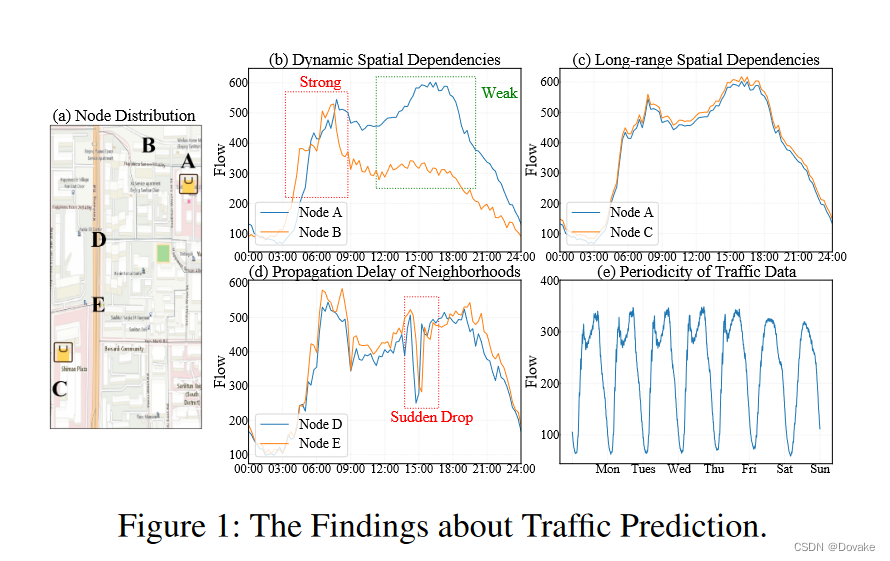
- 在交通系统中,不同地点的空间依赖是十分动态的而不是静态的, 这些依赖变化是随时间变化的。 这是由于受出行模式(应该是早高峰,晚高峰类似的)以及其他特定事件的影响。
- 从图1(a) 可以看出 A和B节点在地图上较近,但是在某些特定的时间上,相关性不一定强。一个在上班的主干道,一个是商业街的路?
- 从图1( c )可以看出, A和较远的C有较强的相关性,比如A和C都在上班的路上。A和C的模式较为接近。
- 从图1(d)可以看出, D和E是同一条路上的两个节点,但是发现同一个节点的相邻交通节点的交通情况具有传播延时性。比如车祸导致堵车,堵车这个会沿着相应的节点进行传播。
Existing methods are often designed locally and unabel to capture long-range dependencies. For example, GNN-based models suffer from over-smothing, making it difficult to capture long-range spatial dependencies. Thirdly, the effect of time delay might occur in the spatial information propagation between locations in a traffic system. For example, when a traffic accident occurs in one location, it will take several minutes(a delay) to affect the traffic condition in neighboring locations, such as nodes D and E in Fig. 1(d). However, such a feature has been ignored in the immediate message passing mechanism of typicl GNN-based models.
To address the above issues, in this paper, we propose a Propagation Delay-aware dynamic long-range trransFormer model, namly PDFormer, for traffic flow prediction. As the core technical contribution, we design a noval spatial self-attention module to capture the dynamic spatial dependencies. This module incorporates local geographic neighborhood and global semantic neighborhood information into the self-attention ineraction via different graph masking methods , which can simulataneously capture the short-and long- range spatial dependencies in traffic data.
- 为了解决以上的问题,设计了PDFormer。
- 设计了空间自注意力模块来捕获动态空间依赖。 这个模块通过不同的图掩码方法将局部的领接图和全局语义领接信息嵌入到自注意力中, 这样在交通数据中,可以同时捕捉到长短距离的空间依赖。
Based on this module, we further design a delay-aware feature transformation module to integrate historical traffic patterns into spatial self-attention and explicity model the time delay of spatial information propagation.
- 基于以上的模块,进一步设计了延迟感知特征转化模块来集成历史交通数据模式到空间自注意力 并且显式建模了空间信息传播。
Notation and Definitions
Definition 1 Road Network.
将道路网络表示为图 G = ( V , ε , A ) G = (V, \varepsilon, A) G=(V,ε,A)
- V = { v 1 , … , v N } V = \{v1, \dots, v_N\} V={ v1,…,vN} 表示N个节点
- ε ⊆ V × V \varepsilon \subseteq V \times V ε⊆V×V 表示边
- A A A表示邻接矩阵
Definition 2 Traffic Flow Tensor
使用 X t ∈ R N × C X_t \in \mathbb R^{N \times C} Xt∈RN×C 表示N个节点的交通流
- N表示N个节点
- C 表示交通流的维度。如C = 2 表示交通流的数据维度。比如可以表示驶入流量和驶出流量
- 使用 X = ( X 1 , X 2 , … , X T ) ∈ R T × N × C X = (X_1, X_2, \dots, X_T) \in \mathbb R^{T\times N \times C} X=(X1,X2,…,XT)∈RT×N×C 表示T时间片段的交通流
Problem Formalization
交通流预测旨在预测交通系统中的通过历史观察数据来获取未来时间的流量。可以将问题描述为:
- X X X 表示观测数据
- 通过学习得到一个函数 f f f 来预测将来的交通流量数据

Methods
图2 展示了PDFormer的框架,包括数据嵌入层,L 层堆叠的 时空 编码器层,以及一个输出层。
Data Embedding Layer
数据嵌入层将输入转化到高维度的表征。
- 首先,原始的输入数据 X X X 将转化到最终的输入数据 X d a t a ∈ R T × N × d X_{data} \in \mathbb R^{T \times N \times d} Xdata∈RT×N×d 通过一个全连接层。 d d d是嵌入维度。
- 然后通过设计的时空嵌入机制来提取必要的知识,并输入网络,包括:
- 空间图拉普拉斯嵌入来表示道路网络结构
- 时间周期嵌入
graph Laplacian embeding
为了表征道路网络结构,使用图像拉普拉斯谱分解。
- 首先得到归一化拉普拉斯矩阵通过公式: Δ = I − D − 1 / 2 A D 1 / 2 \Delta = I - D^{-1/2}A D^{1/2} Δ=I−D−1/2AD1/2。其中 A A A 是邻接矩阵, D D D是度矩阵, I I I 是单位矩阵。
- 使用特征值分解: Δ = U T Λ U \Delta = U^T \Lambda U Δ=UTΛU 得到特征值矩阵 Λ \Lambda Λ 和特征向量矩阵 U U U。
- 此时 U ∈ R N × d U \in \mathbb R^{N \times d} U∈RN×d 根据特征值的大小挑选出 d 个最小的特征相关组成 拉普拉斯特征向量图嵌入。 X s p e ∈ R N × d X_{spe}\in \mathbb R^{N \times d} Xspe∈RN×d
代码实现:
    def _cal_lape(self, adj_mx):
        # 归一化拉普拉斯矩阵
        L, isolated_point_num = self._calculate_normalized_laplacian(adj_mx)
        # 特征值分解
        EigVal, EigVec = np.linalg.eig(L.toarray())
        # 特征值排序,得到排序索引
        idx = EigVal.argsort()
        # 利用特征值得排序索引对特征值和特征向量排序
        EigVal, EigVec = EigVal[idx], np.real(EigVec[:, idx])

        # 去前 self.lape_dim个特征向量组成道路网络的嵌入 $X_{spe}$
        laplacian_pe = torch.from_numpy(EigVec[:, isolated_point_num + 1: self.lape_dim + isolated_point_num + 1]).float()
        laplacian_pe.require_grad = False
        return laplacian_pe
调用
# size: (307, 8)
 self.lap_mx = self._cal_lape(self.adj_mx).to(self.device)
时间周期嵌入
城市交通流也受人们出行模式和生活习惯影响,具有明显的周期性,比如早高峰和晚高峰。因此设计了两个时间周期嵌入:
- 以周为周期的表征 t w ( t ) t_{w(t)} tw(t)
- 以天为周期的表征 t d ( t ) t_{d(t)} td(t)
代码实现:
class DataEmbedding(nn.Module):
    def __init__(
        self, feature_dim, embed_dim, lape_dim, adj_mx, drop=0.,
        add_time_in_day=False, add_day_in_week=False, device=torch.device('cpu'),
    ):
        super().__init__()

        self.add_time_in_day = add_time_in_day
        self.add_day_in_week = add_day_in_week

        self.device = device
        self.embed_dim = embed_dim
        self.feature_dim = feature_dim
        self.value_embedding = TokenEmbedding(feature_dim, embed_dim)

        self.position_encoding = PositionalEncoding(embed_dim)
        if self.add_time_in_day:
            self.minute_size = 1440
            self.daytime_embedding = nn.Embedding(self.minute_size, embed_dim)
        if self.add_day_in_week:
            weekday_size = 7
            self.weekday_embedding = nn.Embedding(weekday_size, embed_dim)
        self.spatial_embedding = LaplacianPE(lape_dim, embed_dim)
        self.dropout = nn.Dropout(drop)

    def forward(self, x, lap_mx):
        # x shape: [16, 12, 307, 9]
        origin_x = x
        x = self.value_embedding(origin_x[:, :, :, :self.feature_dim])  # self.feature_dim = 1         # x shape: [16, 12, 307, 64]
        x += self.position_encoding(x)
        if self.add_time_in_day:
            x += self.daytime_embedding((origin_x[:, :, :, self.feature_dim] * self.minute_size).round().long())
        if self.add_day_in_week:
            x += self.weekday_embedding(origin_x[:, :, :, self.feature_dim + 1: self.feature_dim + 8].argmax(dim=3))
        x += self.spatial_embedding(lap_mx)
        x = self.dropout(x)
        return x
LibCity
1. 数据集介绍PEMS04和PEMS08
1.1 PEM04
- 其中PEMS04是2018年1月1日开始采集的连续59天的307的探测器获得的流量数据。
- 每5分钟采集一次
- 原始流量数据 data.npz 的shape 是 (307, 16992,3)
- 307 表示 307 个摄像头
- 16992 表示 59天 x 24 x 12 个数据。
- 3 表示数据包括 流量、速度、车道占用率。
- 邻接矩阵数据是一个distance.csv文件,它包含是from,to,distance的格式。
1.2 PEM08
- PEMS08是2016年7月1日开始采集的连续62天170个节点的流量数据。
- shape 为 (170, 17856, 3)
- 邻接矩阵数据是一个distance.csv文件,它包含是from,to,distance的格式。