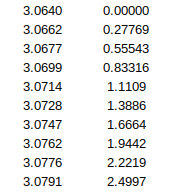
部分数据
test.xlsx 两列,第一列为x, 第二列为y
代码:
# coding=utf-8

import matplotlib
matplotlib.use('TkAgg')
import numpy as np
import matplotlib as mpl
import matplotlib.pyplot as plt
import sys
import xlrd

def read_xlrd(excelFile):
    x=[]
    y=[]
    data = xlrd.open_workbook(excelFile)
    table = data.sheet_by_index(0)
    #print("rows:", table.nrows);

    for rowNum in range(table.nrows):
        rowVale = table.row_values(rowNum)
        x.append(rowVale[0])
        y.append(rowVale[1])
        #print(rowVale[0], rowVale[1])
        #for colNum in range(table.ncols):
            #print(rowVale[colNum])

    return x,y

x,y = read_xlrd(sys.argv[1])

plt.plot(x, y)
plt.grid(True) ##增加格点
plt.show()
执行
python3 show.py ./test.xlsx
注意这里python版本是3
另外matplotlib会有不显示的问题,所以要加matplotlib.use(‘TkAgg’), 不然matplotlib默认的后端无法显示。
示例图

作者:帅得不敢出门