自己常做的几种大屏用到的图表option的基本设置
- 第一种
2
 pieFinishOption: {


        title: [
          {


            text: '完成率',
            x: 'center',
            top: '26%',
            textStyle: {


              color: '#fff',
              fontSize: 12,
              fontWeight: '600',
              fontFamily: 'DOUYU-Font, DOUYU'
            }
          },
          {


            text: '45%',
            x: 'center',
            top: '46%',
            textStyle: {


              fontSize: 26,
              color: '#fff',
              foontWeight: '500'
            }
          }
        ],
        polar: {


          radius: ['85%', '100%']
        },
        angleAxis: {


          max: 100,
          show: false
        },
        radiusAxis: {


          type: 'category',
          show: true,
          axisLabel: {


            show: false
          },
          axisLine: {


            show: false
          },
          axisTick: {


            show: false
          }
        },
        series: [
          {


            name: '',
            type: 'bar',
            roundCap: true,
            barWidth: 6,
            showBackground: true,
            backgroundStyle: {


              color: 'rgba(66, 66, 66, .3)'
            },
            data: [70],
            coordinateSystem: 'polar',
            itemStyle: {


              normal: {


                color: new echarts.graphic.LinearGradient(0, 1, 0, 0, [
                  {


                    offset: 0,
                    color: '#93DCFF'
                  },
                  {


                    offset: 1,
                    color: '#4FB4FF'
                  }
                ])
              }
            }
          }
        ]
      }
第二种:

 unitPieDown: {


        title: [
          {


            text: '47%',
            x: 'center',
            y: 'center',
            textStyle: {


              color: '#63EFFF',
              fontSize: 16,
              fontWeight: '600'
            }
          }
        ],
         polar: {


          radius: ['85%', '100%']
        },
        angleAxis: {


          max: 100,
          show: false
        },
        radiusAxis: {


          type: 'category',
          show: true,
          axisLabel: {


            show: false
          },
          axisLine: {


            show: false
          },
          axisTick: {


            show: false
          }
        },
        series: [
          {


            name: '',
            type: 'bar',
            roundCap: true,
            barWidth: 6,
            stack: 'bar',
            showBackground: true,
             backgroundStyle: {


              color: 'rgba(66, 66, 66, .3)'
            },
            data: [0],
            coordinateSystem: 'polar',
            itemStyle: {


              normal: {


                color: new echarts.graphic.LinearGradient(0, 1, 0, 0, [
                  {


                    offset: 0,
                    color: '#9CF9FF'
                  },
                  {


                    offset: 1,
                    color: '#2FEAFF'
                  }
                ])
              }
            }
          }
        ]
      },
第三种

  barOption: {


        xAxis: [
          {


            type: 'category',
            data: ['本年计划(万元)', '本年完成(万元)'],
            axisLine: {


              show: false
            },
            axisLabel: {


              interval: 0,
              color: '#fff',
              textStyle: {


                fontSize: 10
              }
            },
            // 不显示刻度
            axisTick: {


              show: false
            }
          }
        ],
        yAxis: [
          {


            splitLine: {


              show: false
            },
            axisLabel: {


              show: false
            },
            axisLine: {


              show: false
            },
            // 不显示刻度
            axisTick: {


              show: false
            }
          }
        ],
        series: [
          {


            type: 'bar',
            data: [56, 90],
            barWidth: '40',
            itemStyle: {


              normal: {


                color: (params) => {


                  let colors = [
                    new echarts.graphic.LinearGradient(0, 0, 0, 1, [
                      {


                        offset: 0,
                        color: 'rgba(198, 218, 255, 1)'
                      },
                      {


                        offset: 1,
                        color: 'rgba(0, 23, 69, 0)'
                      }
                    ]),
                    new echarts.graphic.LinearGradient(0, 0, 0, 1, [
                      {


                        offset: 0,
                        color: 'rgba(255, 254, 139, 1)'
                      },
                      {


                        offset: 1,
                        color: 'rgba(52, 48, 0, 0)'
                      }
                    ])
                  ]
                  return colors[params.dataIndex]
                }
              }
            },
            label: {


              normal: {


                show: true,
                lineHeight: 20,
                formatter: '{c}',
                position: 'top',
                textStyle: {


                  color: '#fff',
                  fontSize: 14
                }
              }
            }
          }
        ]
      },
第四种
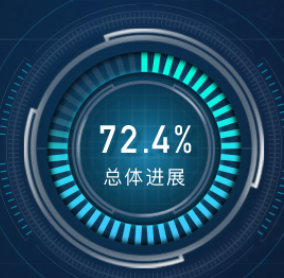
totlePieOption: {


        title: [
          {


            text: '30%',
            x: 'center',
            top: '34%',
            textStyle: {


              color: '#fff',
              fontSize: 36,
              fontWeight: '600'
            }
          },
          {


            text: '总体进展',
            x: 'center',
            top: '56%',
            textStyle: {


              fontSize: 18,
              color: '#fff',
              foontWeight: '500'
            }
          }
        ],
        series: [
          {


            name: '总体进度',
            type: 'pie',
            radius: ['70%', '80%'],
            center: ['50%', '50%'],
            silent: true,
            clockwise: true,
            startAngle: 90,
            z: 0,
            zlevel: 0,
            label: {


              normal: {


                position: 'center'
              }
            },
            data: [
              {


                // value: 50,
                name: '',
                itemStyle: {


                  normal: {


                    color: {


                      // 完成的圆环的颜色
                      colorStops: [
                        {


                          offset: 0,
                          color: '#02FDDB' // 0% 处的颜色
                        },
                        {


                          offset: 1,
                          color: '#3CCBFD' // 100% 处的颜色
                        }
                      ]
                    }
                  }
                }
              },
              {


                // value: 50,
                name: '',
                label: {


                  normal: {


                    show: false
                  }
                },
                itemStyle: {


                  normal: {


                    color: '#3CCBFD',
                    opacity: 0.3
                  }
                }
              }
            ]
          },

          {


            name: '',
            type: 'gauge',
            radius: '80%',
            center: ['50%', '50%'],
            startAngle: 0,
            endAngle: 359.9,
            splitNumber: 45,
            hoverAnimation: true,
            axisTick: {


              show: false
            },
            splitLine: {


              length: 16,
              lineStyle: {


                width: 5,
                color: '#061740'
              }
            },
            axisLabel: {


              show: false
            },
            pointer: {


              show: false
            },
            axisLine: {


              lineStyle: {


                opacity: 0
              }
            },
            detail: {


              show: false
            },
            data: [
              {


                value: 0,
                name: ''
              }
            ]
          }
        ]
      },
第五种

 yardLineOption: {


        polar: {


          radius: ['85%', '100%']
        },
        angleAxis: {


          max: 100,
          show: false
        },
        radiusAxis: {


          type: 'category',
          show: true,
          axisLabel: {


            show: false
          },
          axisLine: {


            show: false
          },
          axisTick: {


            show: false
          }
        },
        series: [
          {


            name: '',
            type: 'bar',
            barWidth: 10,
            showBackground: true,
            backgroundStyle: {


              color: 'rgba(66, 66, 66, .3)'
            },
            data: [90],
            coordinateSystem: 'polar',
            itemStyle: {


              normal: {


                color: '#FFA657'
              }
            }
          }
        ]
      },
第六种

  barOption: {


        color: ['#00EEFF'],
        grid: {


          right: '2%',
          width: '100%',
          containLabel: true
        },
        xAxis: {


          type: 'value',

          splitLine: {


            show: false
          },
          axisLabel: {


            show: false
          },
          axisTick: {


            show: false
          },
          axisLine: {


            show: false
          }
        },
        yAxis: [
          {


            type: 'category',
            inverse: true,
            axisLine: {


              show: false
            },
            axisTick: {


              show: false
            },
            axisPointer: {


              label: {


                show: true
              }
            }
          }
        ],
        series: [
          {


            zlevel: 1,
            name: '',
            type: 'bar',
            barWidth: '6px',
            animationDuration: 1500,
            data: [40],
            align: 'center',
            itemStyle: {


              normal: {


                barBorderRadius: 3
              }
            },
            label: {


              show: false,
              fontSize: 10,
              color: '#fff',
              textBorderWidth: 2,
              padding: [2, 0, 0, 0]
            }
          },
          {


            name: '',
            type: 'bar',
            barWidth: 6,
            barGap: '-100%',
            data: [100],
            itemStyle: {


              normal: {


                color: '#0E374F'
              }
            }
          }
        ]
      },
第七种

 pieOption: {


        title: [
          {


            text: '',
            x: '20%',
            y: 'center',
            textStyle: {


              fontSize: 26,
              color: '#fff',
              foontWeight: '500'
            }
          },
          {


            text: '道',
            x: '62%',
            y: 'center',
            textStyle: {


              fontSize: 14,
              color: '#A4DBFE',
              foontWeight: '500'
            }
          }
        ],
        series: [
          {


            name: 'Access From',
            type: 'pie',
            radius: ['72%', '98%'],
            color: ['#00EEFF', '#FFC334', '#0571C9', '#09E982'],
            data: [{

     value: 44 }, {

     value: 55 }, {

     value: 66 }, {

     value: 77 }],
            itemStyle: {


              borderColor: '#182B47',
              borderWidth: 3
            },
            labelLine: {


              length: 0,
              length2: 0,
              lineStyle: {


                width: 0
              }
            }
          }
        ]
      }