import matplotlib
import matplotlib.pyplot as plt #导入pyplot模块
import numpy as np
# Data for plotting
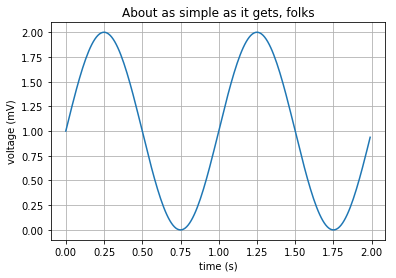
t = np.arange(0.0, 2.0, 0.01)#numpy构建一个数组,0到2之间,步长为0.01
s = 1 + np.sin(2 * np.pi * t)#numpy计算
fig, ax = plt.subplots()#subplots设置画布
ax.plot(t, s)
ax.set(xlabel='time (s)', ylabel='voltage (mV)',
title='About as simple as it gets, folks')#设置图标题,x及y轴名称
ax.grid()#设置网格,默认有网格,可以按照如下设置线性,颜色及宽度
#ax.grid(True, linestyle = "-.", color = "r", linewidth = "1")
fig.savefig("test.png")#保存图像
plt.show()