目录
1 实验数据集
实验数据集采用数据集4:2016年电工数学建模竞赛负荷预测数据集(下载链接),数据集包含日期、最高温度℃ 、最低温度℃、平均温度℃ 、相对湿度(平均) 、降雨量(mm)、日需求负荷(KWh),时间间隔为1H。
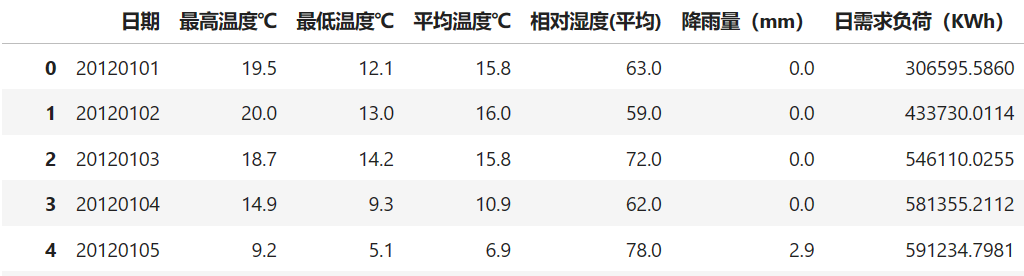
在使用数据之前相对数据进行处理,用其他数据集时也是同样的处理方法。首先读取数据,发数据不是UTF-8格式,通过添加encoding = 'gbk'读取数据,模型传入的数据必须是UTF-8格式。
df= pd.read_table('E:\\课题\\08数据集\\2016年电工数学建模竞赛负荷预测数据集\\2016年电工数学建模竞赛负荷预测数据集.txt',encoding = 'gbk')然后检查数据是否有缺失值:
df.isnull().sum()发现数据存在少量缺失值,分析数据特点,可以通过前项或后项填充填补缺失值:
df = df.fillna(method='ffill')后面需要将表格列名改为英文,时间列名为date,不然后面运行时会报错:
df.columns = ["date","max_temperature(℃)","Min_temperature(℃ )","Average_temperature(℃)","Relative_humidity(average)","Rainfall(mm)","Load"]最后将数据按UTF-8格式保存
load.to_csv('E:\\课题\\08数据集\\2016年电工数学建模竞赛负荷预测数据集\\2016年电工数学建模竞赛负荷预测数据集_处理后.csv', index=False,encoding = 'utf-8')最后可视化看一下数据:
# 可视化
load.drop(['date'], axis=1, inplace=True)
cols = list(load.columns)
fig = plt.figure(figsize=(16,6))
plt.tight_layout()
plt.subplots_adjust(left=None, bottom=None, right=None, top=None, wspace=None, hspace=0.8)
for i in range(len(cols)):
    ax = fig.add_subplot(3,2,i+1)
    ax.plot(load.iloc[:,i])
    ax.set_title(cols[i])
    # plt.subplots_adjust(hspace=1)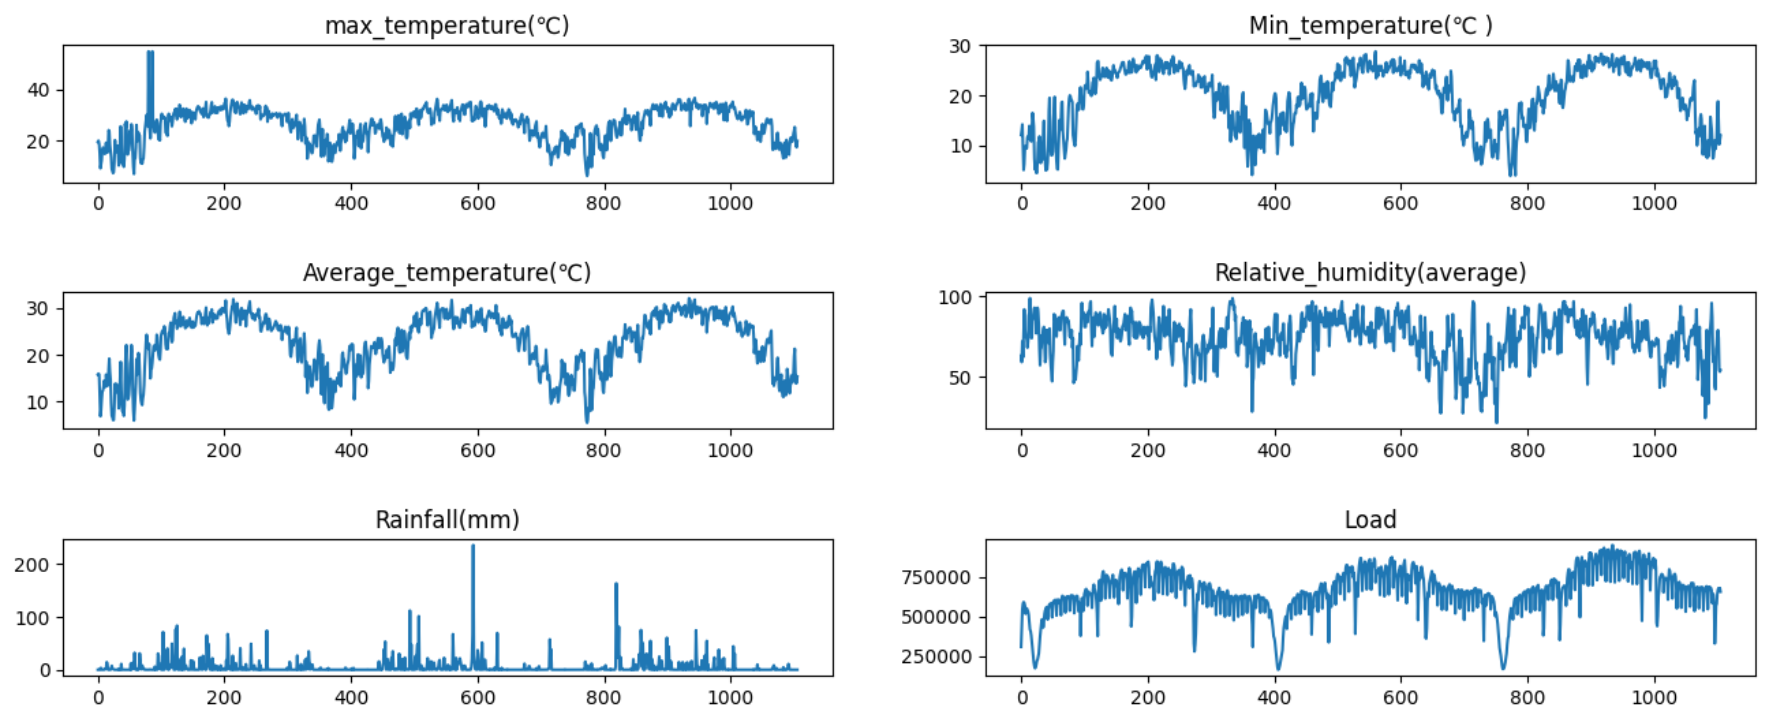
2 如何运行自己的数据集
前面两篇文章介绍了论文的原理、代码解析和官方数据集训练和运行,那么大家在利用模型训练自己的数据集的时候需要修改的几处地方。
parser.add_argument('--data', type=str, default='custom', help='data')
parser.add_argument('--root_path', type=str, default='./data/Load/', help='root path of the data file')
parser.add_argument('--data_path', type=str, default='load.csv', help='data file')
parser.add_argument('--features', type=str, default='MS', help='forecasting task, options:[M, S, MS]; M:multivariate predict multivariate, S:univariate predict univariate, MS:multivariate predict univariate')
parser.add_argument('--target', type=str, default='Load', help='target feature in S or MS task')
parser.add_argument('--freq', type=str, default='h', help='freq for time features encoding, options:[s:secondly, t:minutely, h:hourly, d:daily, b:business days, w:weekly, m:monthly], you can also use more detailed freq like 15min or 3h')- data:必须填写 default='custom',也就是改为自定义的数据
- root_path:填写数据文件夹路径
- data_path:填写具体的数据文件名
- features:前面有讲解,features有三个选项(M,MS,S),分别是多元预测多元,多元预测单元,单元预测单元,具体是看你自己的数据集。
- target:就是你数据集中你想要知道那列的预测值的列名,这里改为Load
- freq:就是你两条数据之间的时间间隔。
parser.add_argument('--seq_len', type=int, default=96, help='input sequence length of Informer encoder')
parser.add_argument('--label_len', type=int, default=48, help='start token length of Informer decoder')
parser.add_argument('--pred_len', type=int, default=24, help='prediction sequence length')- seq_len:用过去的多少条数据来预测未来的数据
- label_len:可以裂解为更高的权重占比的部分要小于seq_len
- pred_len:预测未来多少个时间点的数据
parser.add_argument('--enc_in', type=int, default=6, help='encoder input size')
parser.add_argument('--dec_in', type=int, default=6, help='decoder input size')
parser.add_argument('--c_out', type=int, default=1, help='output size')- enc_in:你数据有多少列,要减去时间那一列,这里我是输入8列数据但是有一列是时间所以就填写7
- dec_in:同上
- c_out:这里有一些不同如果你的features填写的是M那么和上面就一样,如果填写的MS那么这里要输入1因为你的输出只有一列数据。
## 解析数据集的信息 ##
# 字典data_parser中包含了不同数据集的信息,键值为数据集名称('ETTh1'等),对应一个包含.csv数据文件名
# 目标特征、M、S和MS等参数的字典
data_parser = {
    'ETTh1':{'data':'ETTh1.csv','T':'OT','M':[7,7,7],'S':[1,1,1],'MS':[7,7,1]},
    'ETTh2':{'data':'ETTh2.csv','T':'OT','M':[7,7,7],'S':[1,1,1],'MS':[7,7,1]},
    'ETTm1':{'data':'ETTm1.csv','T':'OT','M':[7,7,7],'S':[1,1,1],'MS':[7,7,1]},
    'ETTm2':{'data':'ETTm2.csv','T':'OT','M':[7,7,7],'S':[1,1,1],'MS':[7,7,1]},
    'WTH':{'data':'WTH.csv','T':'WetBulbCelsius','M':[12,12,12],'S':[1,1,1],'MS':[12,12,1]},
    'ECL':{'data':'ECL.csv','T':'MT_320','M':[321,321,321],'S':[1,1,1],'MS':[321,321,1]},
    'Solar':{'data':'solar_AL.csv','T':'POWER_136','M':[137,137,137],'S':[1,1,1],'MS':[137,137,1]},
    'Custom':{'data':'load.csv','T':'Load','M':[137,137,137],'S':[1,1,1],'MS':[6,6,1]},
}
预测结果保存在result文件下,保存格式为numpy,可以通过下面的脚本进行可视化预测结果:
import numpy as np
import pandas as pd
import matplotlib.pyplot as plt
# 指定.npy文件路径
file_path1 = "results/informer_ETTh1_ftM_sl96_ll48_pl24_dm512_nh8_el2_dl1_df2048_atprob_fc5_ebtimeF_dtTrue_mxTrue_test_0/true.npy"
file_path2 = "results/informer_ETTh1_ftM_sl96_ll48_pl24_dm512_nh8_el2_dl1_df2048_atprob_fc5_ebtimeF_dtTrue_mxTrue_test_1/pred.npy"
# 使用NumPy加载.npy文件
true_value = []
pred_value = []
data1 = np.load(file_path1)
data2 = np.load(file_path2)
print(data2)
for i in range(24):
true_value.append(data2[0][i][6])
pred_value.append(data1[0][i][6])
# 打印内容
print(true_value)
print(pred_value)
#保存数据
df = pd.DataFrame({'real': true_value, 'pred': pred_value})
df.to_csv('results.csv', index=False)
#绘制图形
fig = plt.figure(figsize=( 16, 8))
plt.plot(df['real'], marker='o', markersize=8)
plt.plot(df['pred'], marker='o', markersize=8)
plt.tick_params(labelsize = 28)
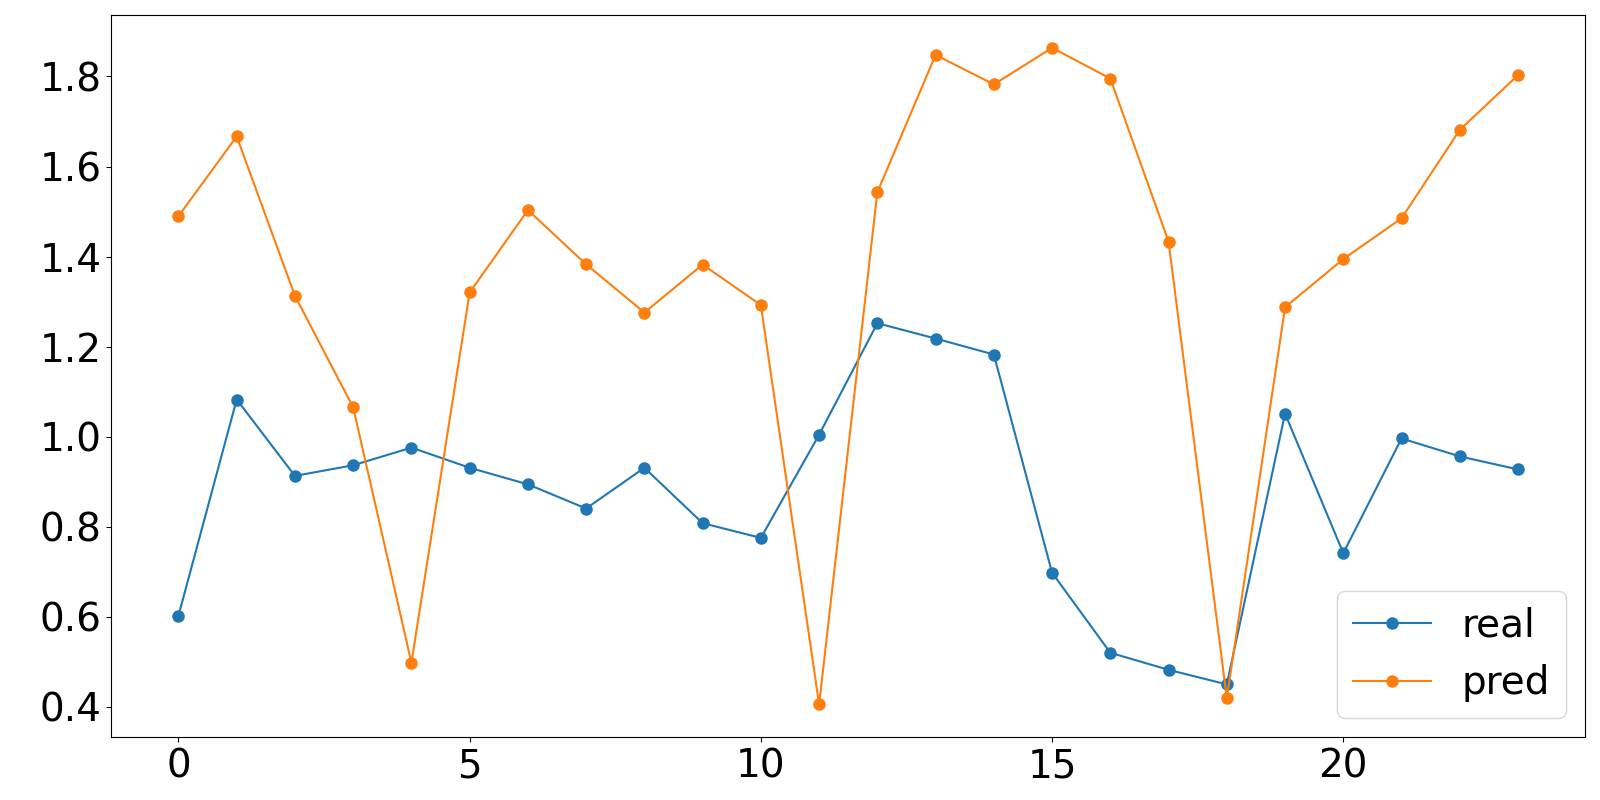
plt.legend(['real','pred'],fontsize=28)
plt.show()最后预测的效果如下,发现并不是太好,后续看参数调优后是否能提升模型预测效果。
3 报错分析
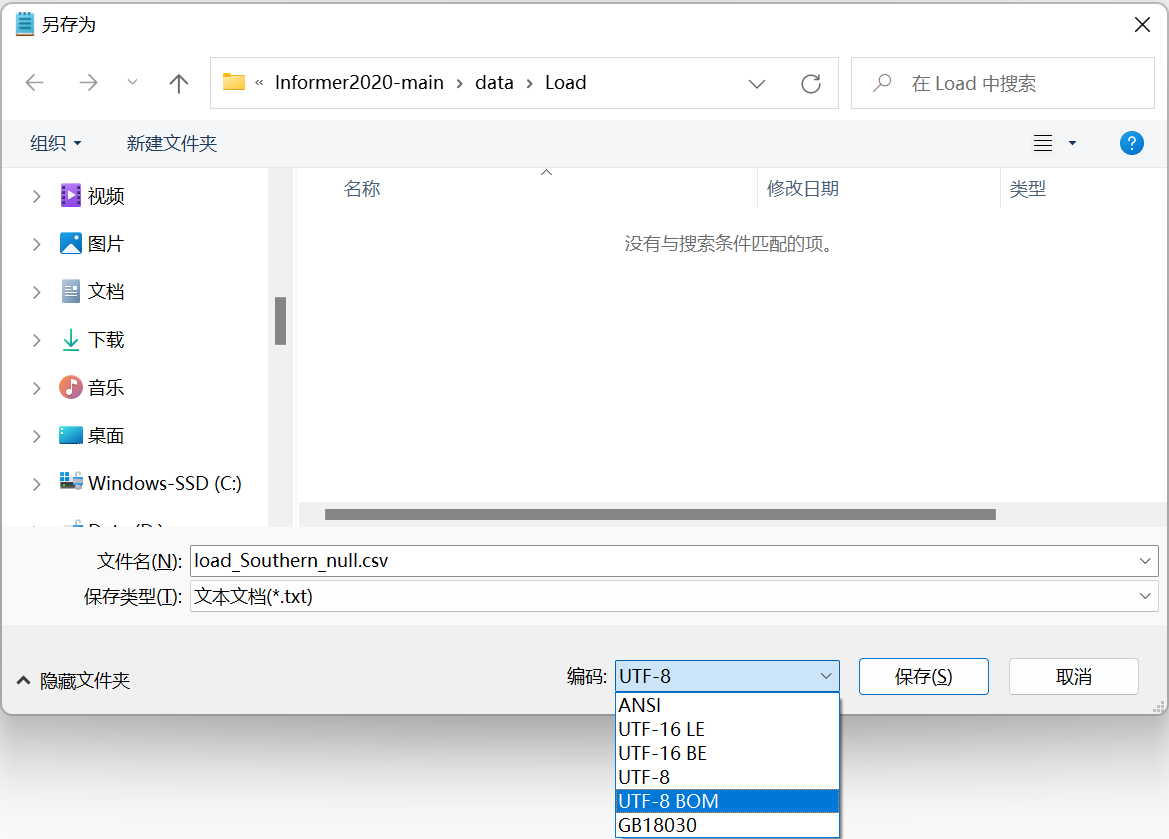
报错1:UnicodeDecodeError: 'utf-8' codec can't decode bytes in position 56-57: invalid continuation byte,具体来说,'utf-8' 编解码器无法解码文件中的某些字节,因为它们不符合 UTF-8 编码的规则。
  File "D:\Progeam Files\python\lib\site-packages\pandas\io\parsers\c_parser_wrapper.py", line 93, in __init__
    self._reader = parsers.TextReader(src, **kwds)
  File "pandas\_libs\parsers.pyx", line 548, in pandas._libs.parsers.TextReader.__cinit__
  File "pandas\_libs\parsers.pyx", line 637, in pandas._libs.parsers.TextReader._get_header
  File "pandas\_libs\parsers.pyx", line 848, in pandas._libs.parsers.TextReader._tokenize_rows
  File "pandas\_libs\parsers.pyx", line 859, in pandas._libs.parsers.TextReader._check_tokenize_status
  File "pandas\_libs\parsers.pyx", line 2017, in pandas._libs.parsers.raise_parser_error
UnicodeDecodeError: 'utf-8' codec can't decode bytes in position 56-57: invalid continuation byte
解决办法:
(1) 根据提示,要将数据更改'utf-8'格式,最简便的方法将数据用记事本打开,另存为是通过UTF-8格式保存
(2) 尝试使用其他编解码器(如 'latin1')来读取文件,或者在读取文件时指定正确的编码格式。
报错2:ValueError: list.remove(x): x not in list,试从列表中删除两个元素,但是这两个元素中至少有一个不在列表中。
File "E:\课题\07代码\Informer2020-main\Informer2020-main\data\data_loader.py", line 241, in __read_data__
cols = list(df_raw.columns); cols.remove(self.target); cols.remove('date')
ValueError: list.remove(x): x not in list解决办法:在没有找到具体原因的时候可以在删除元素之前先检查一下列表中是否包含要删除的元素,或者使用 try-except 语句来捕获异常,以便在元素不存在时不会导致程序中断。通过检查,数据中的列名最好改为英文,避免产生乱码。
if self.cols:
    cols=self.cols.copy()
    cols.remove(self.target)
else:
    # 添加调试信息
    cols = list(df_raw.columns)
    print(cols)  # 输出列的内容
    if self.target in cols:
        cols.remove(self.target)
    else:
        print(f"{self.target} not in columns")
    if 'date' in cols:
        cols.remove('date')
    else:
        print("date not in columns")
    # 添加调试信息

    cols = list(df_raw.columns); cols.remove(self.target); cols.remove('date')
df_raw = df_raw[['date']+cols+[self.target]]