<!DOCTYPE html>
<html lang="en">
<head>
<meta charset="UTF-8">
<meta name="viewport" content="width=device-width, initial-scale=1.0">
<meta http-equiv="X-UA-Compatible" content="ie=edge">
<title>vue2 antv/g2 基础饼图</title>
<style>
#app {
margin: 50px auto;
text-align: center;
}
</style>
</head>
<!--vue-->
<script src="https://cdn.staticfile.org/vue/2.7.0/vue.min.js"></script>
<!-- 引入G2在线资源 -->
<script src="https://gw.alipayobjects.com/os/lib/antv/g2/3.4.10/dist/g2.min.js"></script>
<body>
<div id="app">
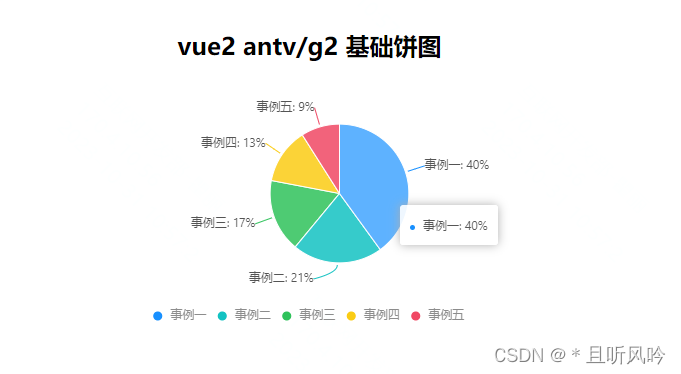
<h2>{
{ msg }}</h2>
<div id="chartcontainer"></div>
</div>
<script>
var app = new Vue({
el: '#app',
data: {
msg: '',
chart: null, // 创建一个chart变量
list: [{
item: '事例一',
count: 40,
percent: 0.4
}, {
item: '事例二',
count: 21,
percent: 0.21
}, {
item: '事例三',
count: 17,
percent: 0.17
}, {
item: '事例四',
count: 13,
percent: 0.13
}, {
item: '事例五',
count: 9,
percent: 0.09
}]
},
mounted() {
this.msg = 'vue2 antv/g2 基础饼图'
// 初始化chart
const chart = new G2.Chart({
container: 'chartcontainer',
forceFit: true,
height: 300
})
chart.source(this.list, {
percent: {
formatter: function formatter(val) {
val = val * 100 + '%';
return val;
}
}
})
chart.coord('theta', {
radius: 0.75
});
chart.tooltip({
showTitle: false,
itemTpl: '<li><span style="background-color:{color};" class="g2-tooltip-marker"></span>{name}: {value}</li>'
});
chart.intervalStack().position('percent').color('item')
.label('percent', {
formatter: function formatter(val, item) {
return item.point.item + ': ' + val;
}
})
.tooltip('item*percent', function(item, percent) {
percent = percent * 100 + '%';
return {
name: item,
value: percent
}
})
.style({
lineWidth: 1,
stroke: '#fff'
})
this.chart = chart // 将chart变量赋值为vue中的chart, 后面可以直接使用this.chart调用图表对象
this.chart.render()
}
})
</script>
</body>
</html>
页面效果: