<!DOCTYPE html>
<html>
<head>
<meta charset="UTF-8">
<title>柱状图点击事件</title>
</head>
<body>
<div id="container" />
<script src="https://gw.alipayobjects.com/os/lib/antv/g2/4.2.8/dist/g2.min.js"></script>
<script src="https://gw.alipayobjects.com/os/antv/pkg/_antv.data-set-0.11.1/dist/data-set.js"></script>
<script>
<!-- 浏览器引入,请使用全局命名空间 G2,如 new Chart() 改为 new G2.Chart,即可运行。 -->
const data = [
{
month: 'Jan', city: 'Tokyo', temperature: 7 },
{
month: 'Jan', city: 'London', temperature: 3.9 },
{
month: 'Feb', city: 'Tokyo', temperature: 6.9 },
{
month: 'Feb', city: 'London', temperature: 4.2 },
{
month: 'Mar', city: 'Tokyo', temperature: 9.5 },
{
month: 'Mar', city: 'London', temperature: 5.7 },
{
month: 'Apr', city: 'Tokyo', temperature: 14.5 },
{
month: 'Apr', city: 'London', temperature: 8.5 },
{
month: 'May', city: 'Tokyo', temperature: 18.4 },
{
month: 'May', city: 'London', temperature: 11.9 },
{
month: 'Jun', city: 'Tokyo', temperature: 21.5 },
{
month: 'Jun', city: 'London', temperature: 15.2 },
{
month: 'Jul', city: 'Tokyo', temperature: 25.2 },
{
month: 'Jul', city: 'London', temperature: 17 },
{
month: 'Aug', city: 'Tokyo', temperature: 26.5 },
{
month: 'Aug', city: 'London', temperature: 16.6 },
{
month: 'Sep', city: 'Tokyo', temperature: 23.3 },
{
month: 'Sep', city: 'London', temperature: 14.2 },
{
month: 'Oct', city: 'Tokyo', temperature: 18.3 },
{
month: 'Oct', city: 'London', temperature: 10.3 },
{
month: 'Nov', city: 'Tokyo', temperature: 13.9 },
{
month: 'Nov', city: 'London', temperature: 6.6 },
{
month: 'Dec', city: 'Tokyo', temperature: 9.6 },
{
month: 'Dec', city: 'London', temperature: 4.8 },
];
const chart = new G2.Chart({
container: 'container',
autoFit: true,
height: 500,
});
chart.data(data);
chart.tooltip({
showCrosshairs: true,
shared: true,
});
chart.axis('temperature', {
label: {
formatter: (val) => {
return val + ' °C';
},
},
});
chart
.interval()
.position('month*temperature')
.color('city')
.adjust([
{
type: 'dodge',
marginRatio: 0,
},
])
chart.interaction('active-region')
chart.render();
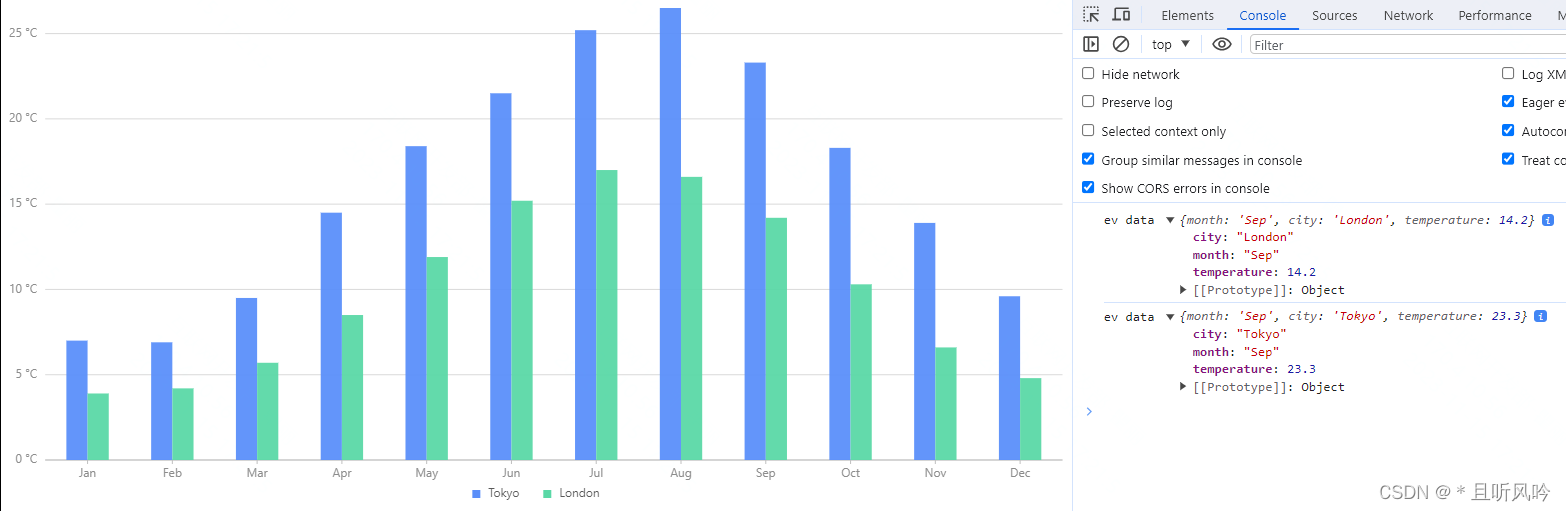
// 监听click事件
chart.on('element:click',(ev)=>{
const data=ev.data.data;
console.log('ev data',data)
})
</script>
</body>
</html>
页面效果: